Copyright
©2012 Baishideng Publishing Group Co.
World J Gastroenterol. Nov 28, 2012; 18(44): 6452-6460
Published online Nov 28, 2012. doi: 10.3748/wjg.v18.i44.6452
Published online Nov 28, 2012. doi: 10.3748/wjg.v18.i44.6452
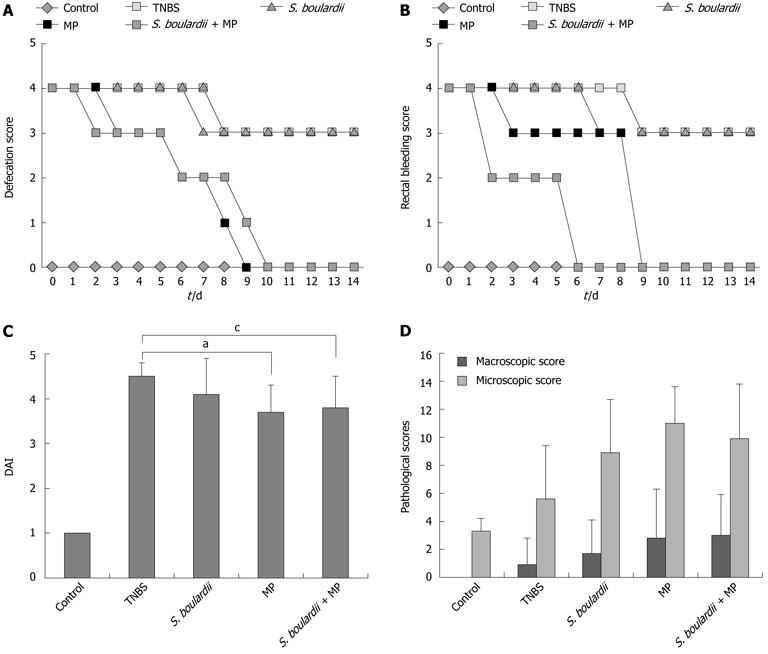
Figure 1 Daily defecation trends, rectal bleeding scores, disease activity index analyses, macro- and microscopic pathological scores of the experimental groups.
A: Daily defecation trends; B: Rectal bleeding scores; C: Disease activity index analyses; The results are shown as the mean ± SD. aP = 0.018 between trinitrobenzene sulfonic acid (TNBS) and methyl prednisolone (MP) group; cP = 0.025 between TNBS and Saccharomyces boulardii (S. boulardii) and TNBS group; D: Macro- and microscopic pathological scores. The results are shown as the mean ± SD. DAI: Disease activity index.
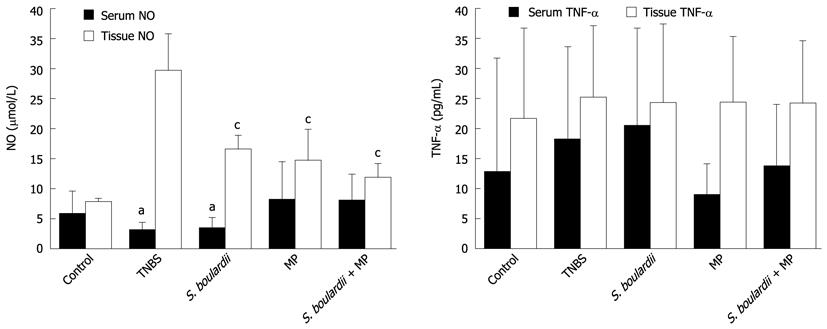
Figure 2 Serum and tissue nitric oxide and tumor necrosis factor-α levels of the experimental groups.
A: Serum and tissue nitric oxide levels; B: Serum and tissue tumor necrosis factor (TNF)-α levels. The results are shown as the mean ± SD. aP < 0.05 vs Saccharomyces boulardii (S. boulardii) + methyl prednisolone (MP); cP < 0.05 vs trinitrobenzene sulfonic acid (TNBS). NO: Nitric oxide.
-
Citation: Soyturk M, Saygili SM, Baskin H, Sagol O, Yilmaz O, Saygili F, Akpinar H. Effectiveness of
Saccharomyces boulardii in a rat model of colitis. World J Gastroenterol 2012; 18(44): 6452-6460 - URL: https://www.wjgnet.com/1007-9327/full/v18/i44/6452.htm
- DOI: https://dx.doi.org/10.3748/wjg.v18.i44.6452


