Copyright
©2012 Baishideng Publishing Group Co.
World J Gastroenterol. Nov 14, 2012; 18(42): 6076-6087
Published online Nov 14, 2012. doi: 10.3748/wjg.v18.i42.6076
Published online Nov 14, 2012. doi: 10.3748/wjg.v18.i42.6076
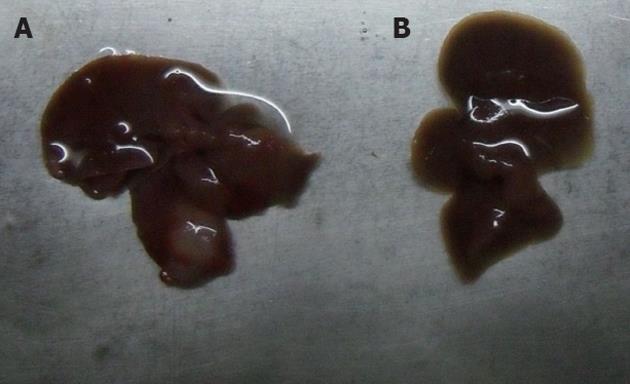
Figure 1 Establishment of the hepatic cancer mouse model.
A: Liver cancer; B: Normal mouse liver.
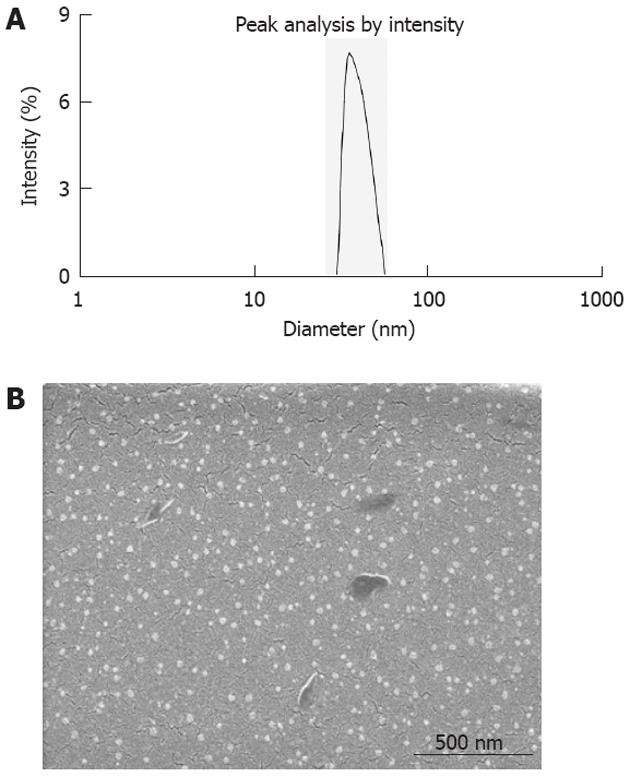
Figure 2 Particle size and scanning electron microscope image of galactosylated chitosan/5-fluorouracil.
A: Particle size graph showing the diameter of galactosylated chitosan/5-fluorouracil (GC/5-FU) (35.19 ± 9.50 nm); B: Scanning electron microscope image of GC/5-FU. The particles show spherical structure with a smooth surface and no adhesion between nanoparticles.
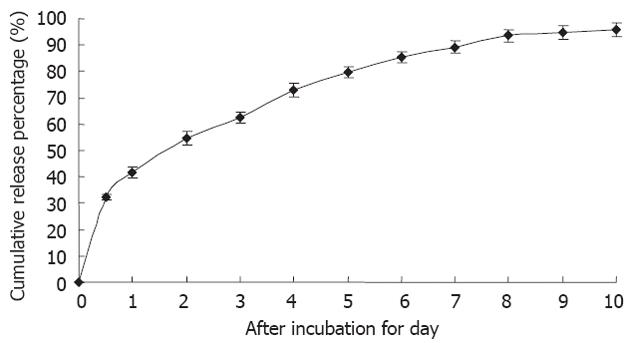
Figure 3 The in vitro release curve of nanoparticles in simulated body fluid (37 °C, pH 7.
4, n = 3). A rapid release was observed from time 0 h to 12 h, with a cumulative release percentage of 32.4%; a smooth slow-release occurred between day 1 and day 8, with a cumulative release percentage of 93.50%. During days 8 to 10, the release reached a plateau, with a cumulative release percentage of 95.70% at day 10.
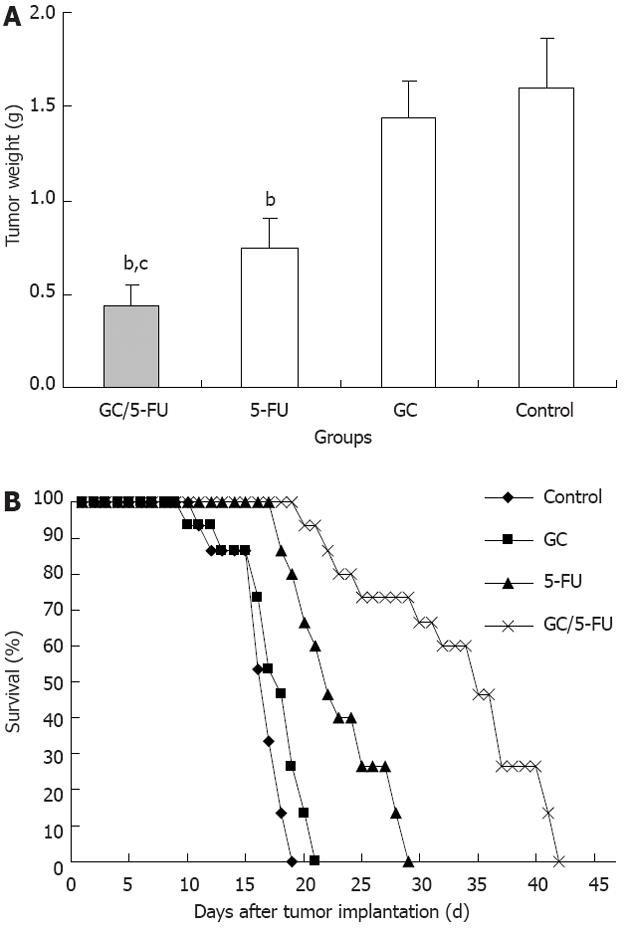
Figure 4 The curative effect of galactosylated chitosan/5-fluorouracil on liver cancer in the orthotopic transplant model of hepatocellular carcinoma.
A: Five days after the tumor was established, galactosylated chitosan/5-fluorouracil (GC/5-FU), 5-FU, GC or phosphate buffered solution was given to the mice. Tumor weight was measured at day 15; B: Treatment was given as described previously and the survival was monitored. The median survival for control, GC, 5-FU and GC/5-FU groups were 12, 13, 17 and 30 d, respectively. bP < 0.01 vs control group; cP < 0.05 vs 5-FU group.
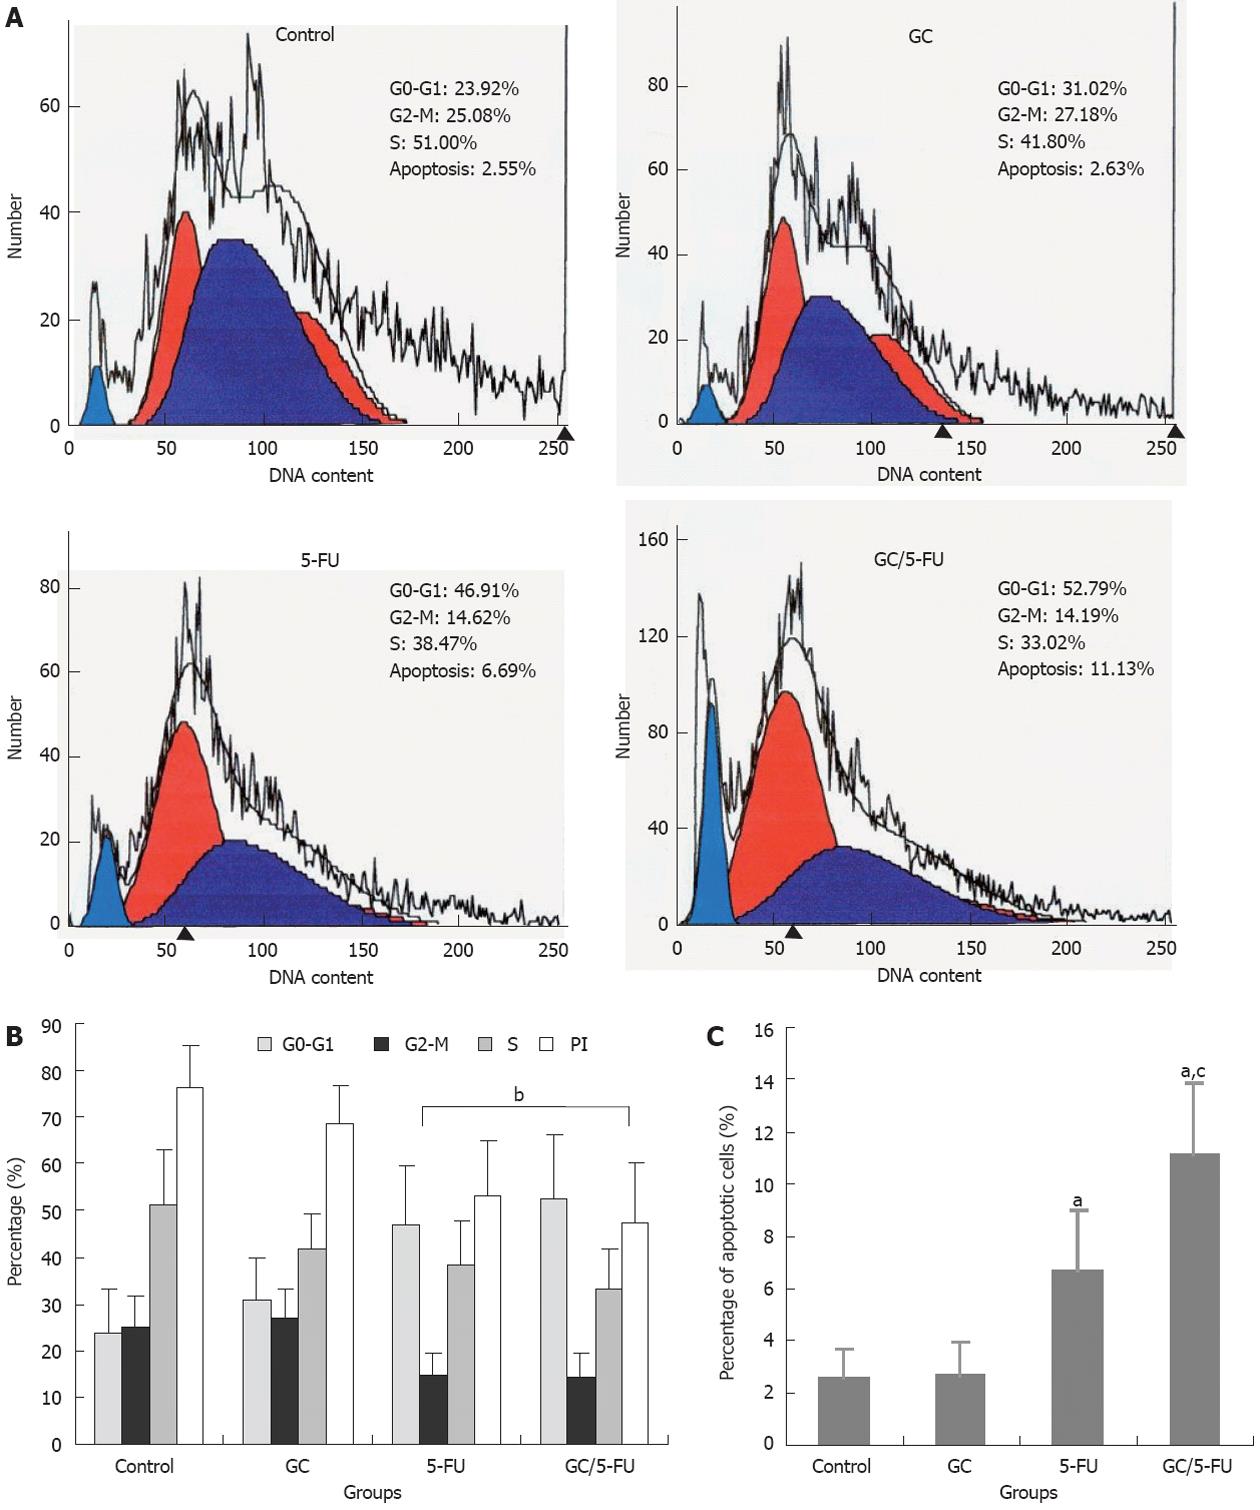
Figure 5 The effects of different treatments on cell cycle, proliferation index and apoptosis index.
A: Flow cytometry analysis of cell cycle distribution of mouse liver cancer cell line (H22) cells; B: Quantification of cell cycle distribution and proliferation index of H22 cells. Percentage of cells in G0-G1 in the galactosylated chitosan/5-fluorouracil (GC/5-FU) and 5-FU groups was higher than that in control and GC groups, while the proliferation index (PI) decreased significantly (P < 0.01); C: Quantification of apoptosis of H22 in different treatment groups. aP < 0.05, bP < 0.01 vs control group; cP < 0.05 vs 5-FU group.
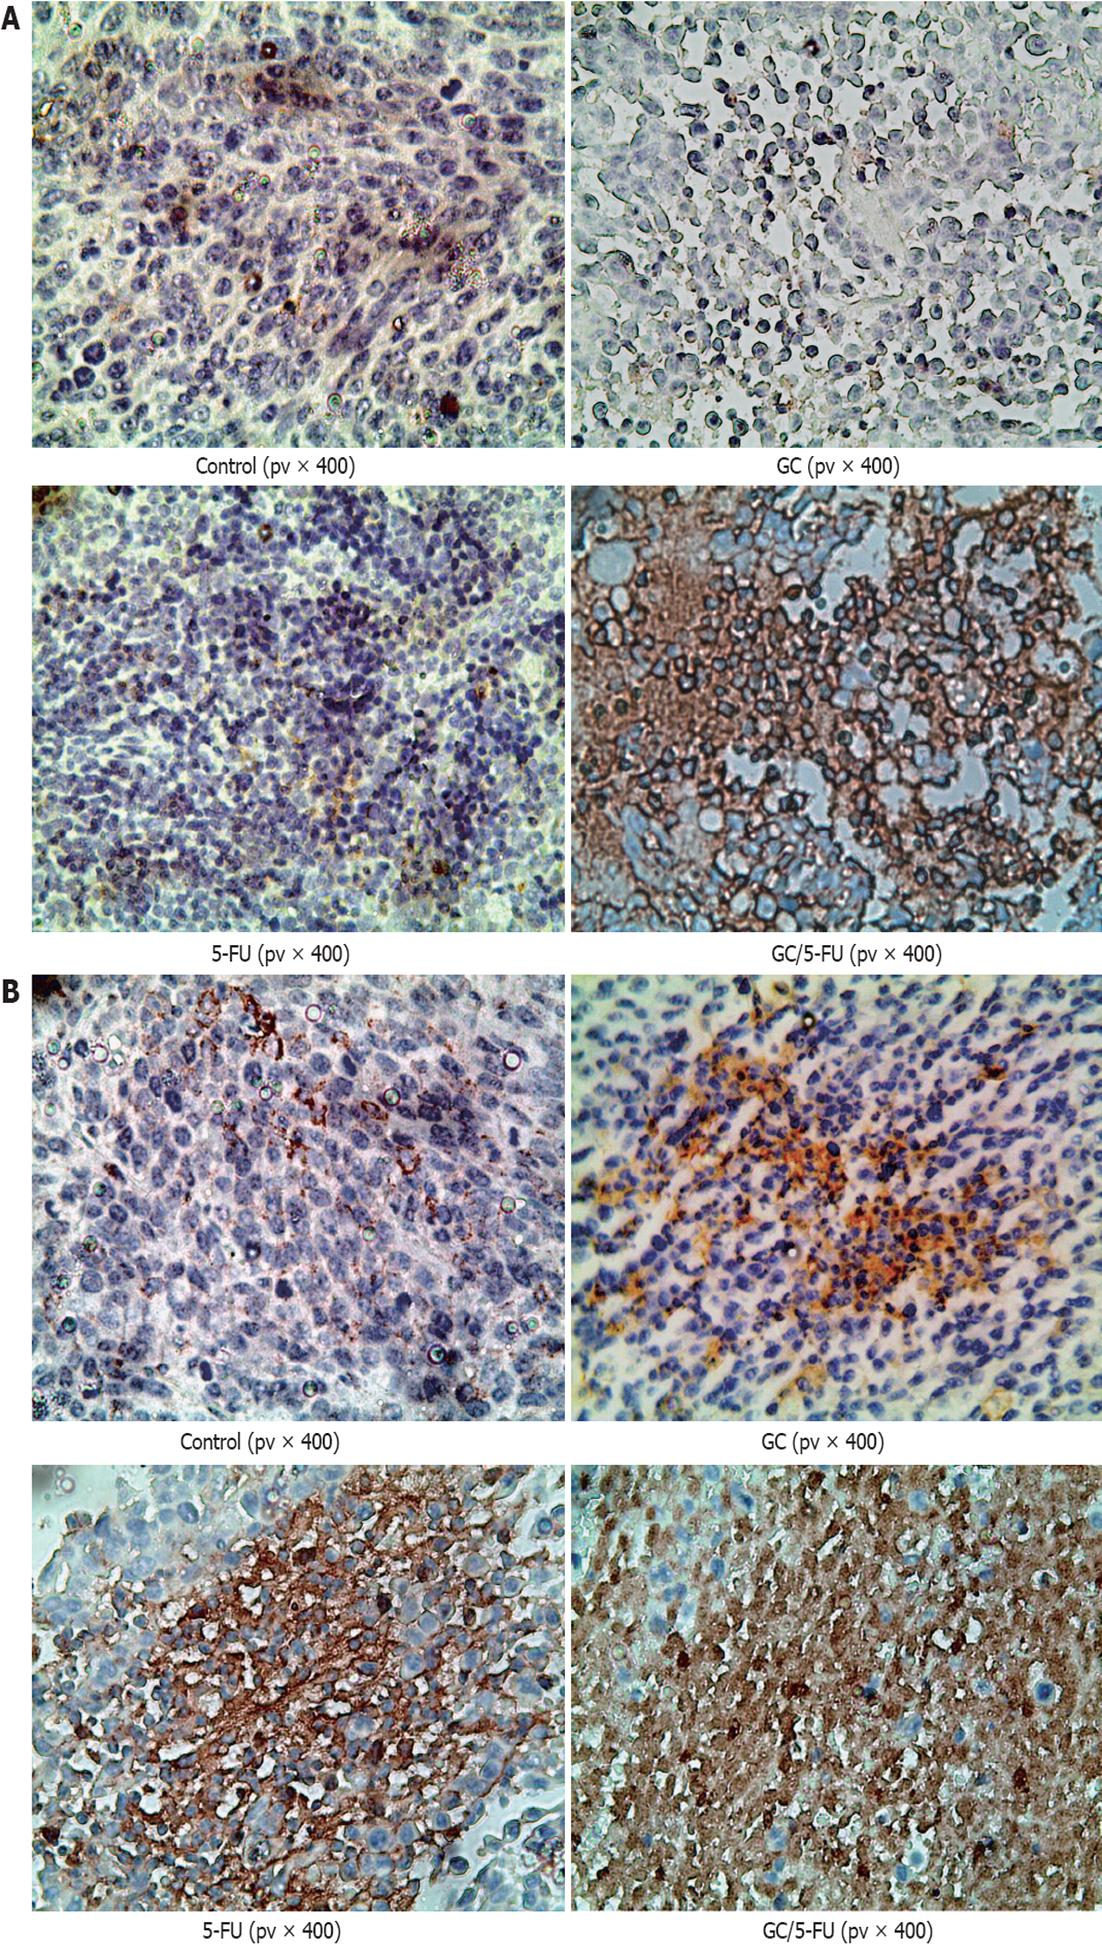
Figure 6 Immunohistochemistry of p53 and caspase-3 in the tumor sections from mice with different treatments.
A: p53 staining in the control and galactosylated chitosan (GC) groups showed a scattered nuclear distribution pattern, in dark yellow or dark brown; while in 5-fluorouracil (5-FU) and GC/5-FU groups, p53 showed a sheet staining pattern, which was more dramatic; B: Caspase-3 staining in the control and GC groups showed a scattered cytoplasmic distribution pattern, in dark yellow or dark brown; while in 5-FU and GC/5-FU groups, caspase-3 showed a sheet staining pattern, which was more dramatic in the GC/5-FU group.
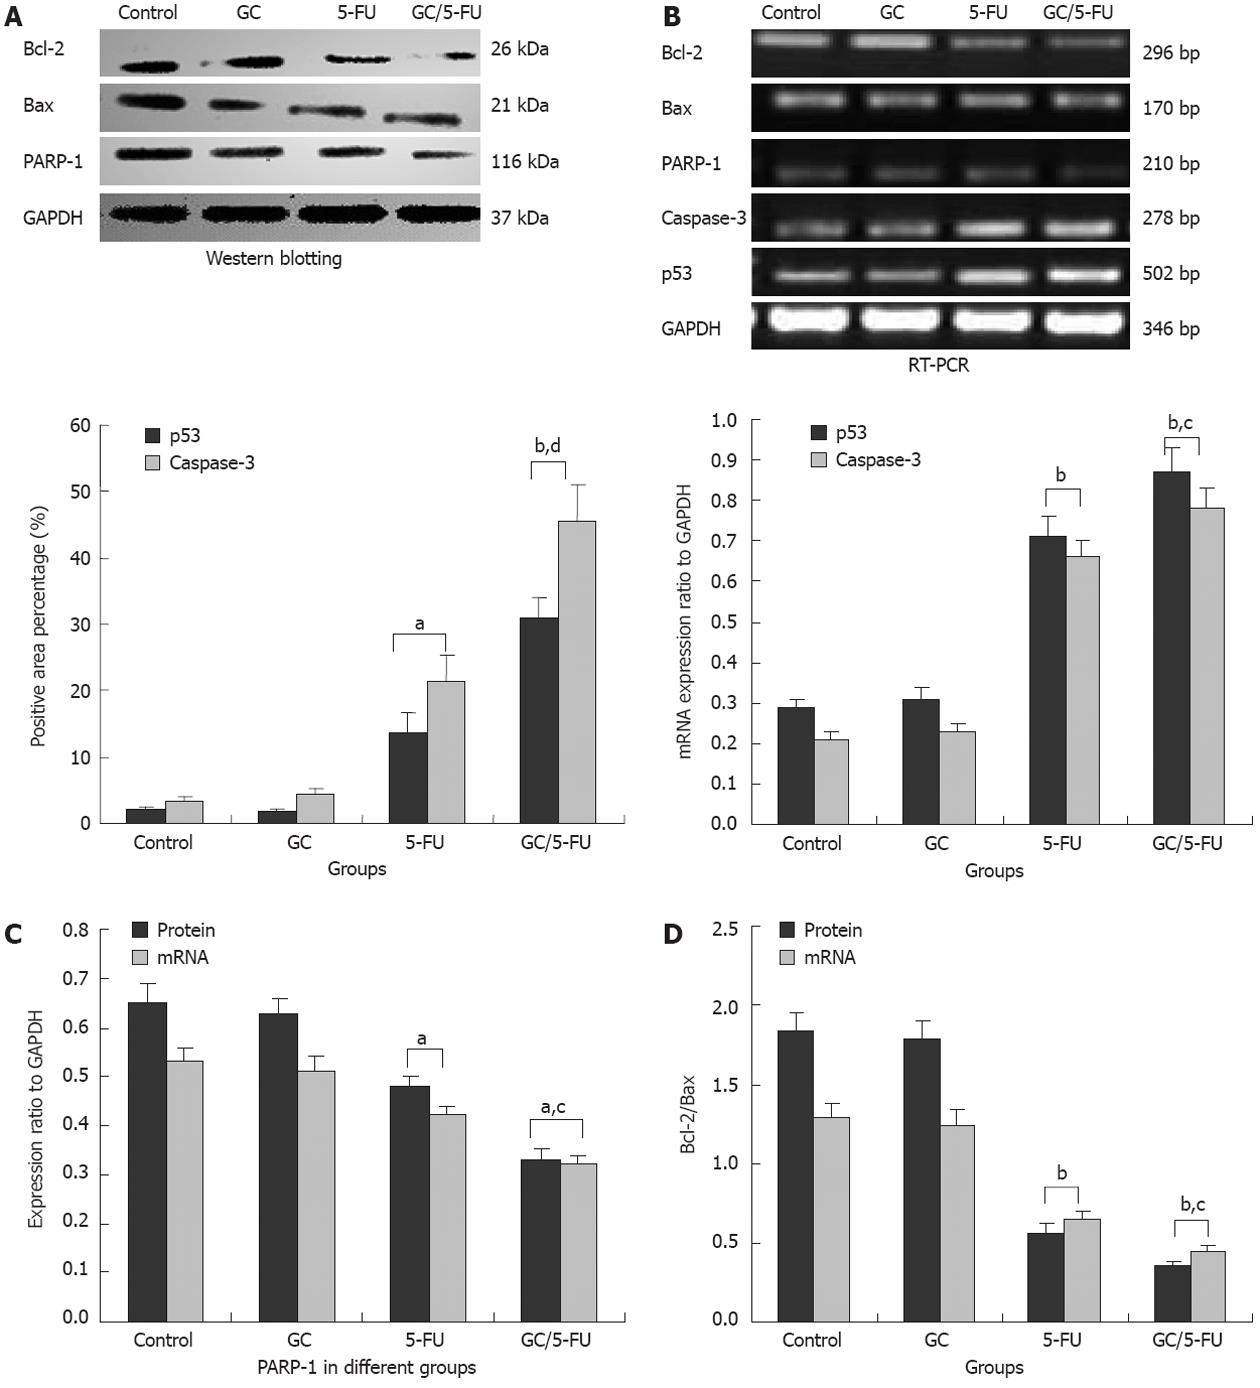
Figure 7 Expression of p53, caspase-3, Bax, Bcl-2 and poly adenosine 50-diphosphate-ribose polymerase 1 in the tumor tissues from mice with different treatments.
A: Quantification of p53 and caspase-3 expression as detected by immunohistochemistry and shown pictorially in Figures 6 and 7; B: mRNA levels of p53 and caspase-3 in individual tissues was measured by reverse transcription-polymerase chain reaction (RT-PCR), and normalized to glyceraldehyde-3-phosphate dehydrogenase (GAPDH); C: Poly adenosine 50-diphosphate-ribose polymerase 1 (PARP-1) expression in individual tumor samples was determined by both RT-PCR and western blot analysis; results were normalized to GAPDH; D: Expression of Bcl-2 and Bax was quantified by both RT-PCR and Western blotting; the ratio of Bcl-2/Bax was shown. aP < 0.05, bP < 0.01 vs control group; cP < 0.05, dP < 0.01 vs 5-fluorouracil (5-FU) group. GC: Galactosylated chitosan.
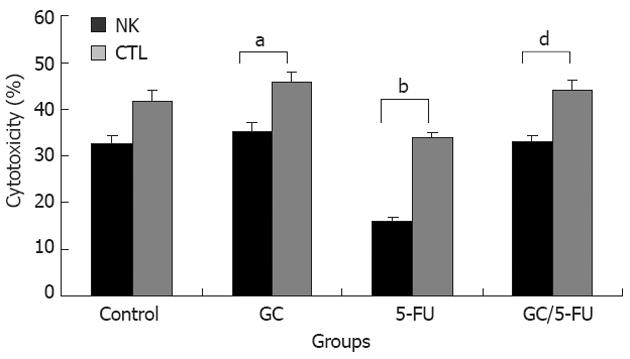
Figure 8 The activity of cytotoxicity T lymphocyte and natural killer cell was detected by 3-(4, 5-dimethylthiazd-2-yl)-2,5-diphenyltentrazolium bromide in the orthotopic transplant model of hepatocellular carcinoma.
The cytotoxic activities of cytotoxicity T lymphocyte (CTL) and natural killer (NK) cells were significantly decreased in 5-fluorouracil (5-FU) group compared with other three groups (P < 0.01), while, the crosscurrent was found in galactosylated chitosan (GC) group compared with 5-FU group (P < 0.05). aP < 0.05, bP < 0.01 vs control group; dP < 0.01 vs 5-FU group.
- Citation: Cheng MR, Li Q, Wan T, He B, Han J, Chen HX, Yang FX, Wang W, Xu HZ, Ye T, Zha BB. Galactosylated chitosan/5-fluorouracil nanoparticles inhibit mouse hepatic cancer growth and its side effects. World J Gastroenterol 2012; 18(42): 6076-6087
- URL: https://www.wjgnet.com/1007-9327/full/v18/i42/6076.htm
- DOI: https://dx.doi.org/10.3748/wjg.v18.i42.6076


