Copyright
©2012 Baishideng Publishing Group Co.
World J Gastroenterol. Oct 28, 2012; 18(40): 5709-5718
Published online Oct 28, 2012. doi: 10.3748/wjg.v18.i40.5709
Published online Oct 28, 2012. doi: 10.3748/wjg.v18.i40.5709
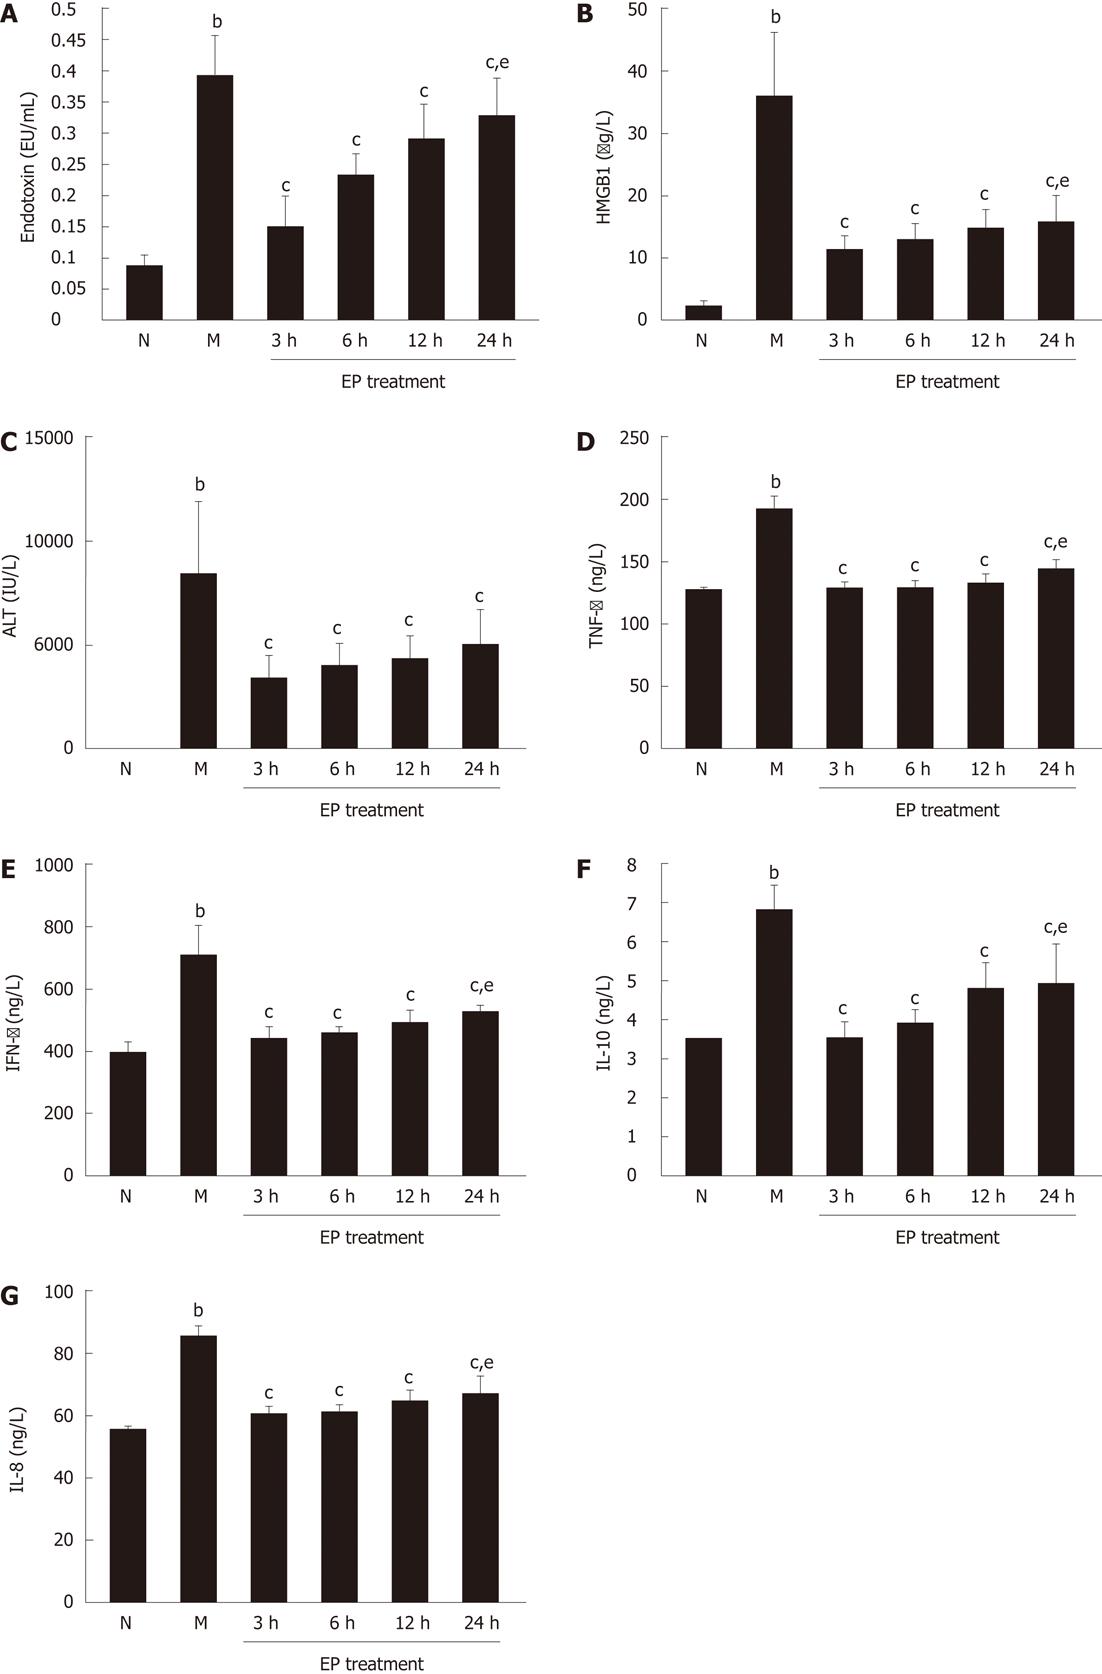
Figure 1 Effect of ethyl pyruvate on serum endotoxin, high mobility group box-1, hepatic enzyme and inflammatory cytokines in rat acute-on-chronic liver failure model.
A: Endotoxin; B: High mobility group box-1 (HMGB1); C: Alanine transaminase (ALT); D: Tumor necrosis factor-α (TNF-α); E: Interferon-γ (IFN-γ); F: Interleukin (IL)-10; G: IL-18. bP < 0.01 vs normal; cP < 0.05 vs model; eP < 0.05 vs ethyl pyruvate (EP) treatment at 3 h. Results are expressed as mean ± SD (n = 5). N: Normal group; M: Model group.
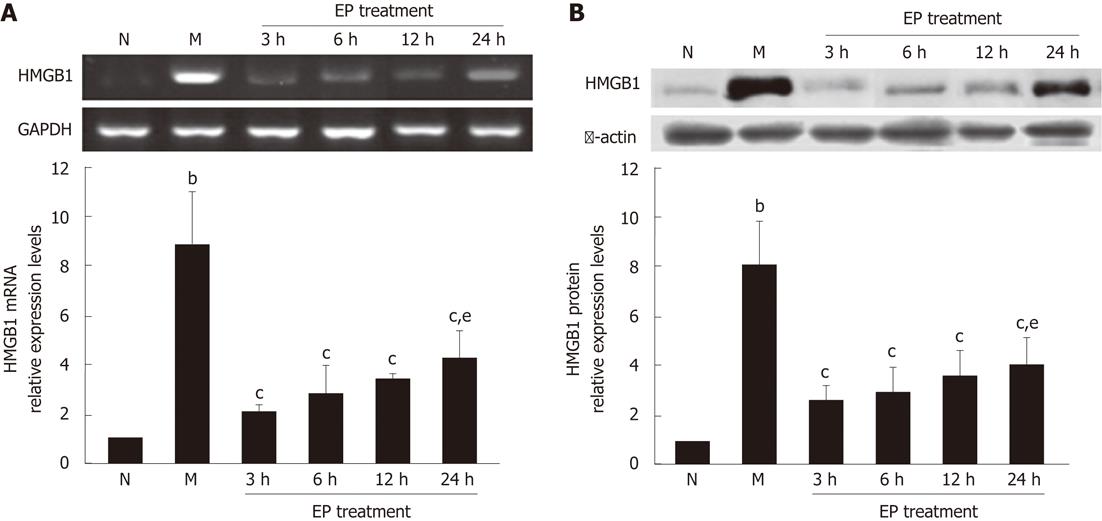
Figure 3 Effect of ethyl pyruvate on high mobility group box-1 expression in liver tissues of rat acute-on-chronic liver failure model.
A: A representative reverse transcription-polymerase chain reaction specific for high mobility group box-1 (HMGB1) mRNA and glyceraldehyde-3-phosphate dehydrogenase (GAPDH) mRNA (internal control) in each group shown in the electrophotogram; B: Western blot assay showing the expression of HMGB1 protein in the liver tissues of rats in each group. bP < 0.01 vs normal; cP < 0.05 vs model; eP < 0.05 vs ethyl pyruvate (EP) treatment at 3 h. The time points of 3 h, 6 h, 12 h and 24 h represent four subgroups of EP treatment group. Results are expressed as mean ± SD (n = 5). N: Normal group; M: Model group.
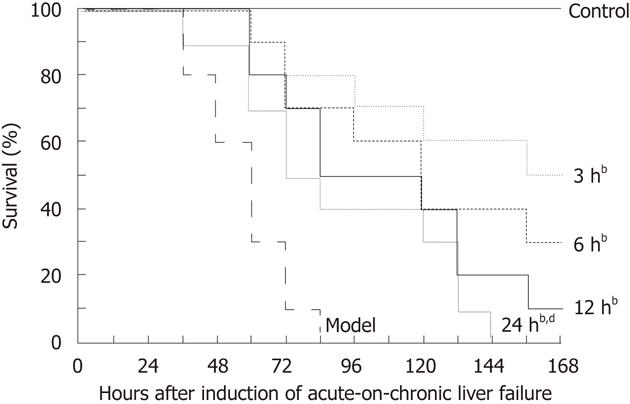
Figure 4 Effect of ethyl pyruvate on survival in rat acute-on-chronic liver failure model.
Kaplan-Meier survival curves showed that the median survival time of the model group was 60 h, and the median survival time in ethyl pyruvate treatment group was 162 h, 120 h, 102 h and 78 h, respectively, after treatment at 3 h, 6 h, 12 h and 24 h. By log-rank test, bP < 0.01 vs model; dP < 0.01 vs 3 h.
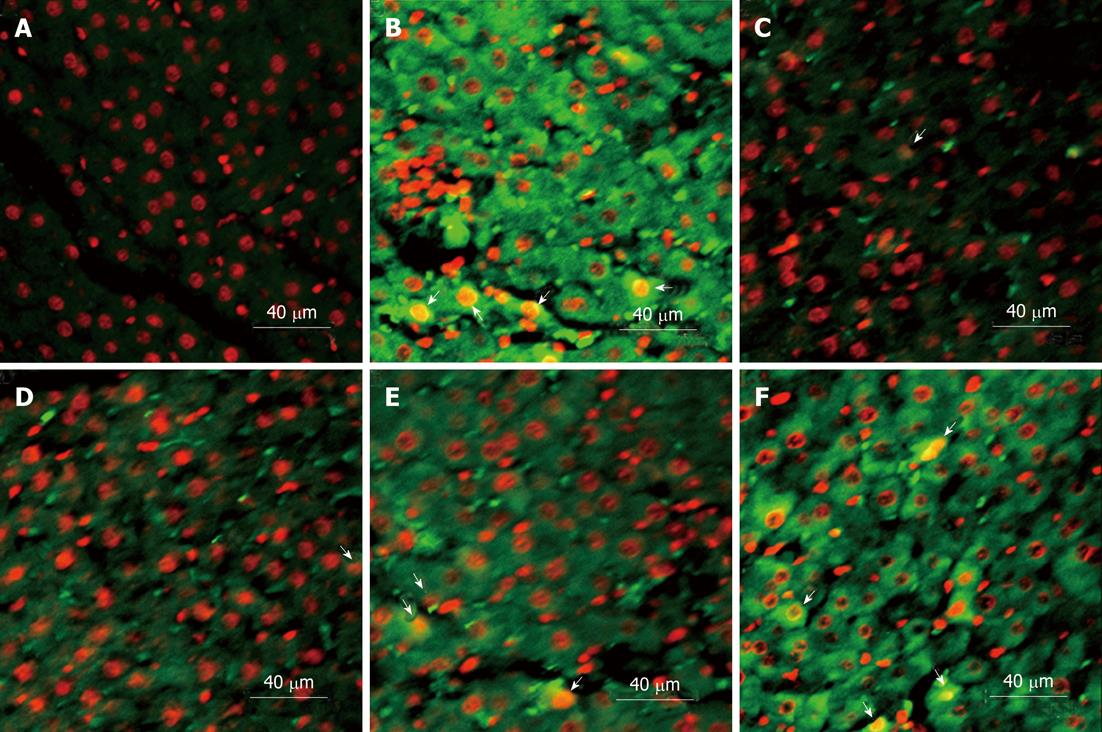
Figure 5 Immunofluorescence and confocal microscopy of high mobility group box-1 expression.
Subcellular high mobility group box-1 expression (green fluorescence) was mainly localized in the cytoplasm, and also observed in a small number of nuclei (arrows). A: Normal group; B: Model group; C-F: Ethyl pyruvate treatment at 3 h, 6 h, 12 h and 24 h.
- Citation: Wang LW, Wang LK, Chen H, Fan C, Li X, He CM, Gong ZJ. Ethyl pyruvate protects against experimental acute-on-chronic liver failure in rats. World J Gastroenterol 2012; 18(40): 5709-5718
- URL: https://www.wjgnet.com/1007-9327/full/v18/i40/5709.htm
- DOI: https://dx.doi.org/10.3748/wjg.v18.i40.5709


