Copyright
©2012 Baishideng Publishing Group Co.
World J Gastroenterol. Jan 28, 2012; 18(4): 340-348
Published online Jan 28, 2012. doi: 10.3748/wjg.v18.i4.340
Published online Jan 28, 2012. doi: 10.3748/wjg.v18.i4.340
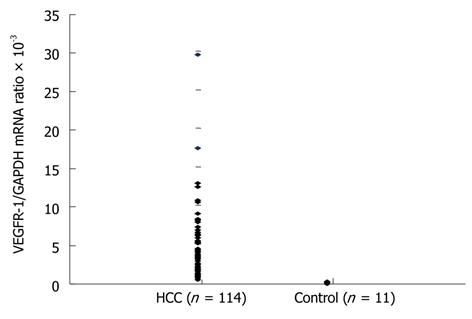
Figure 1 Expression of vascular endothelial growth factor receptor-1 mRNA in bone marrow detected by real-time quantitative reverse transcription polymerase chain reaction.
The mean VEGFR-1/GAPDH mRNA ratio in the bone marrow (BM-VEGFR-1 mRNA) of normal controls was 0.1497 × 10⁻³ (range: 0.0212 × 10⁻³-0.3213 × 10⁻³). The mean BM-VEGFR-1 mRNA level in HCC patients was measured at 3.8474 × 10⁻³ (range: 0.3481 × 10⁻³-29.5885 × 10⁻³). HCC: Hepatocellular carcinoma; VEGFR: Vascular endothelial growth factor receptor; BM: Bone marrow; GAPDH: Glyceraldehyde-3-phosphate dehydrogenase.
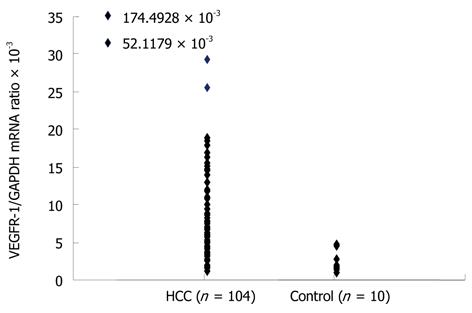
Figure 2 Expression of vascular endothelial growth factor receptor-1 mRNA in peripheral blood detected by real-time quantitative real-time quantitative reverse transcription polymerase chain reaction.
The mean VEGFR-1/GAPDH mRNA ratio in the peripheral blood (PH-VEGFR-1 mRNA) of normal controls was 2.4944 × 10⁻³ (range: 1.0730 × 10⁻³-4.6958 × 10⁻³). The mean PH-VEGFR-1 mRNA level in HCC patients was 9.1285 × 10⁻³ (range: 1.2774 × 10⁻³-174.4928 × 10⁻³). HCC: Hepatocellular carcinoma; VEGFR: Vascular endothelial growth factor receptor; PH: Peripheral blood; GAPDH: Glyceraldehyde-3-phosphate dehydrogenase.
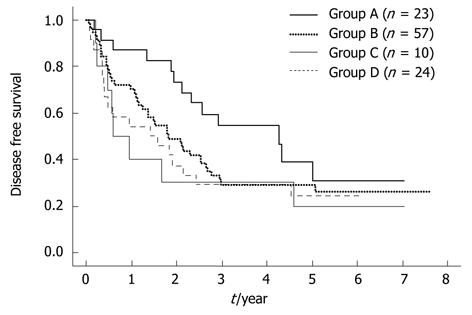
Figure 3 Patients were classified into four groups according to the level/status of their bone marrow-vascular endothelial growth factor receptor-1 and bone marrow-α-fetoprotein mRNA as follows: group A (n = 23), bone marrow-vascular endothelial growth factor receptor-1/bone marrow-α-fetoprotein mRNA = low/negative; group B (n = 57) high/negative; group C (n = 10) low/positive; group D (n = 24), high/positive.
The disease-free survival (DFS) curve of group A was significantly better than that of groups B, C or D (P = 0.0437, P = 0.0325, P = 0.0225).
- Citation: Kamiyama T, Takahashi M, Nakanishi K, Yokoo H, Kamachi H, Kobayashi N, Ozaki M, Todo S. α-fetoprotein, vascular endothelial growth factor receptor-1 and early recurrence of hepatoma. World J Gastroenterol 2012; 18(4): 340-348
- URL: https://www.wjgnet.com/1007-9327/full/v18/i4/340.htm
- DOI: https://dx.doi.org/10.3748/wjg.v18.i4.340


