Copyright
©2012 Baishideng Publishing Group Co.
World J Gastroenterol. Oct 7, 2012; 18(37): 5197-5204
Published online Oct 7, 2012. doi: 10.3748/wjg.v18.i37.5197
Published online Oct 7, 2012. doi: 10.3748/wjg.v18.i37.5197
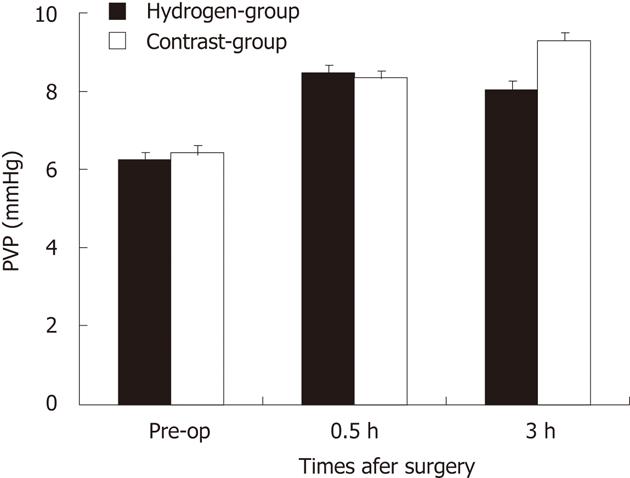
Figure 1 Serial changes of portal vein pressure in two groups.
A bar graph shows the mean ± SD of portal vein pressure (PVP) (mmHg) in the two groups. Each group is represented by the mean of 7 swines. There was no significant difference in changes of PVP between two groups at the pre-operation (pre-op), 0.5 h and 3 h.
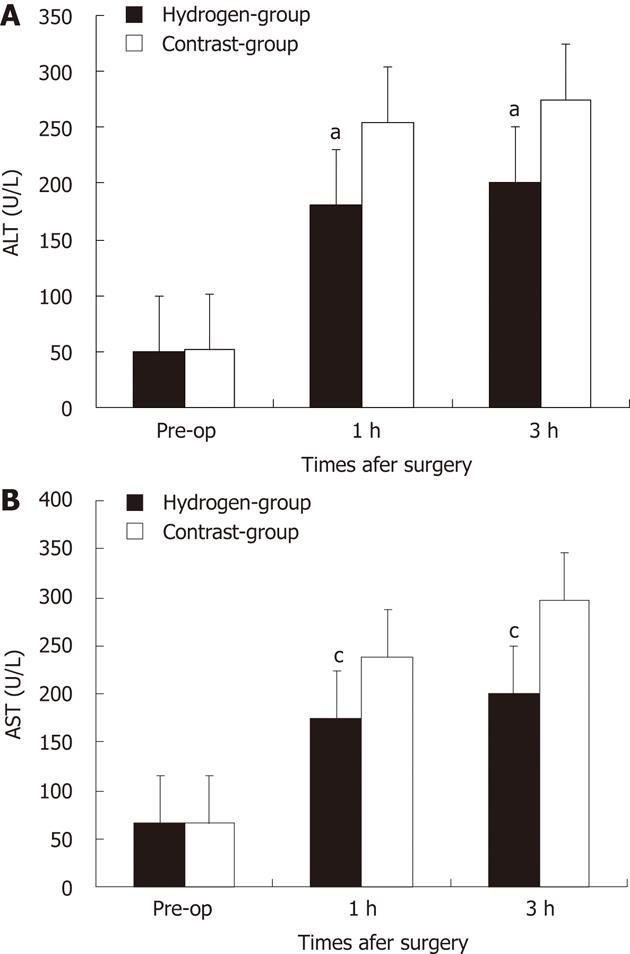
Figure 2 Change of serum alanine aminotransferase level and serum aspartate aminotransferase level in two groups.
Each group is represented by the mean of 7 swines. A, B: In hydrogen gas treated-group, the alanine aminotransferase (ALT) (A) and aspartate aminotransferase (AST) (B) levels were significantly lower to Contrast-group. aP < 0.05 vs ALT level in Contrast-group; cP < 0.05 vs AST level in Contrast-group. Pre-op: Pre-operation.
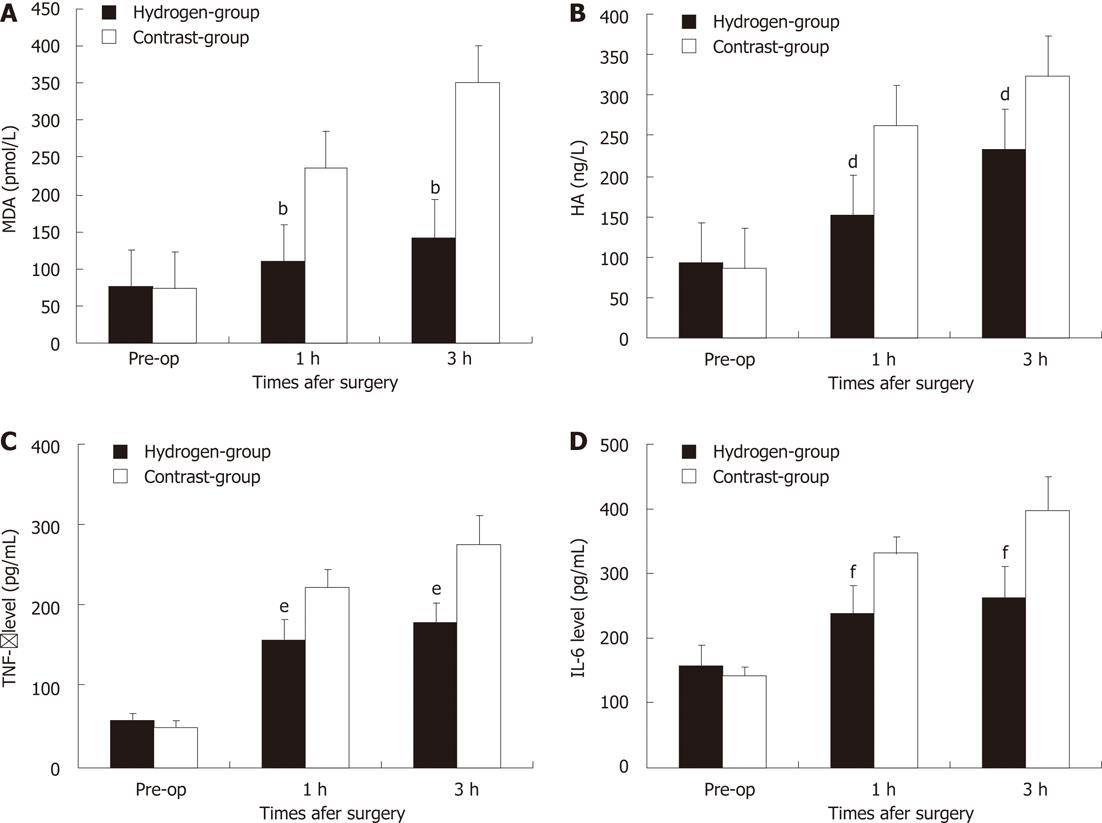
Figure 3 Changes of hepatic malondialdehyde, hyaluronic acid, tumer necrosis factor-α and interleukin-6 levels in two groups.
A bar graph shows the mean ± SD of hepatic malondialdehyde (MDA) (A), hyaluronic acid (HA) (B), tumer necrosis factor (TNF)-α (C) and interleukin (IL)-6 (D) level in two groups. Each group is represented by the mean of 7 swines. A, B: In hydrogen gas treated-group, the MDA (A) and HA (B) levels were significantly lower to Contrast-group; C, D: In hydrogen gas treated-group, the TNF-α (C) and IL-6 (D) levels were significantly lower to Contrast-group. Pre-op: Pre-operation. bP < 0.01 vs MDA level in Contrast-group; dP < 0.01 vs HA level in Contrast-group; eP < 0.01 vs TNF-α level in Contrast-group; fP < 0.01 vs IL-6 level in Contrast-group.
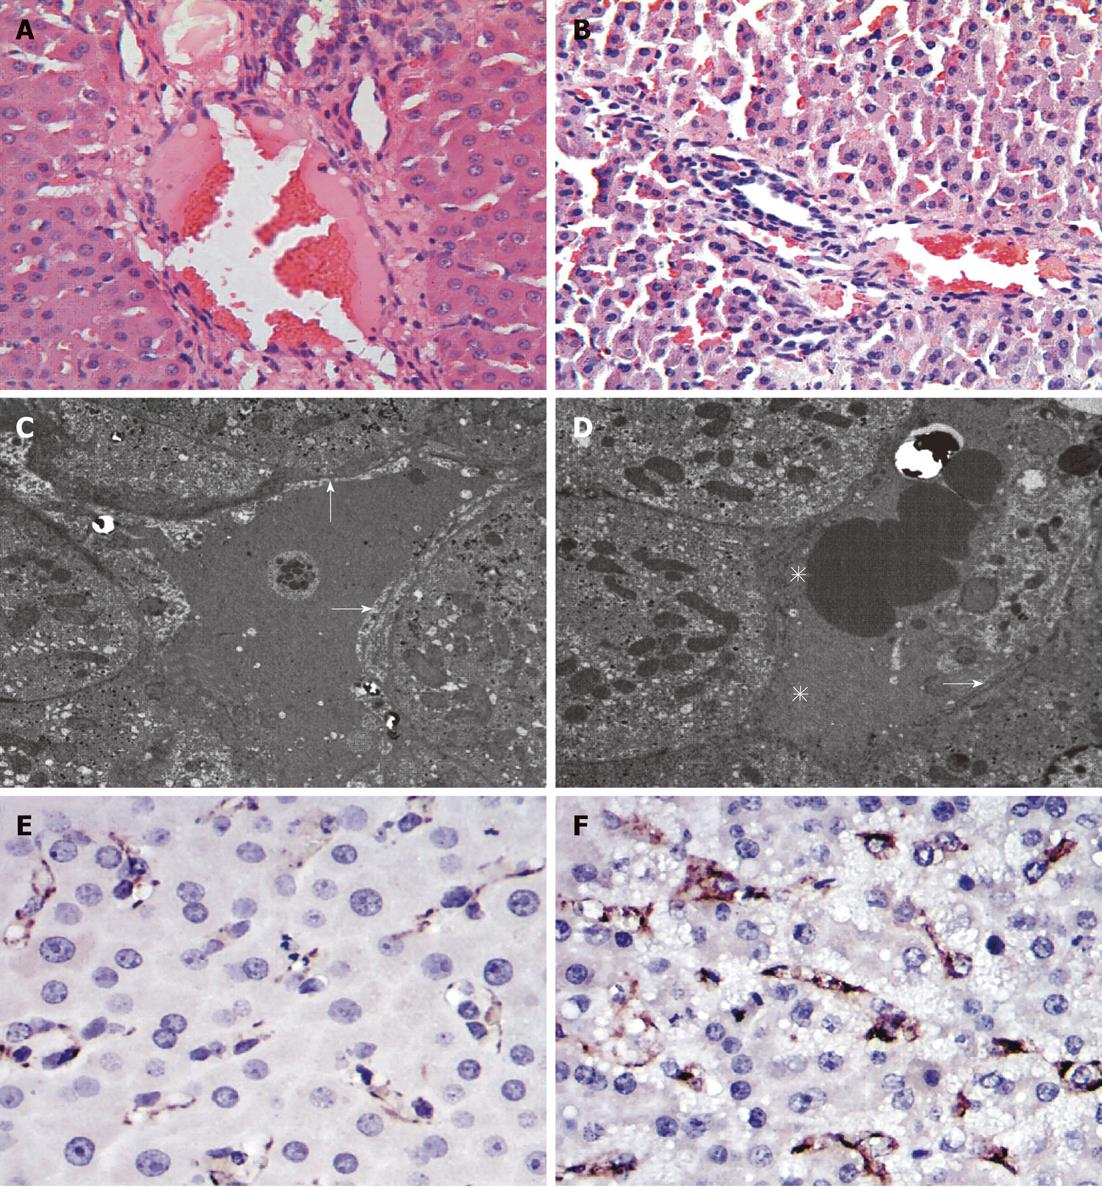
Figure 4 Hematoxylin and eosin, transmission electron microscopic photographs and cluster of differentiation molecule 31 immunohistochemical staining of tissue samples taken 3 h after hepatotectomy.
A: Hematoxylin and eosin (HE) staining of the Contrast-group; B: HE staining of the hydrogen gas treated-group; C, D: Transmission electron microscopic photographs of the sinusoid, arrows indicatethe sinusoidal endothelial, asterisks indicate the enlargement of the Disse's spaces; E: Cluster of differentiation molecule 31 (CD31) immunostaining of the hydrogen gas treated-group; F: CD31 immunostaining of the Contrast-group.
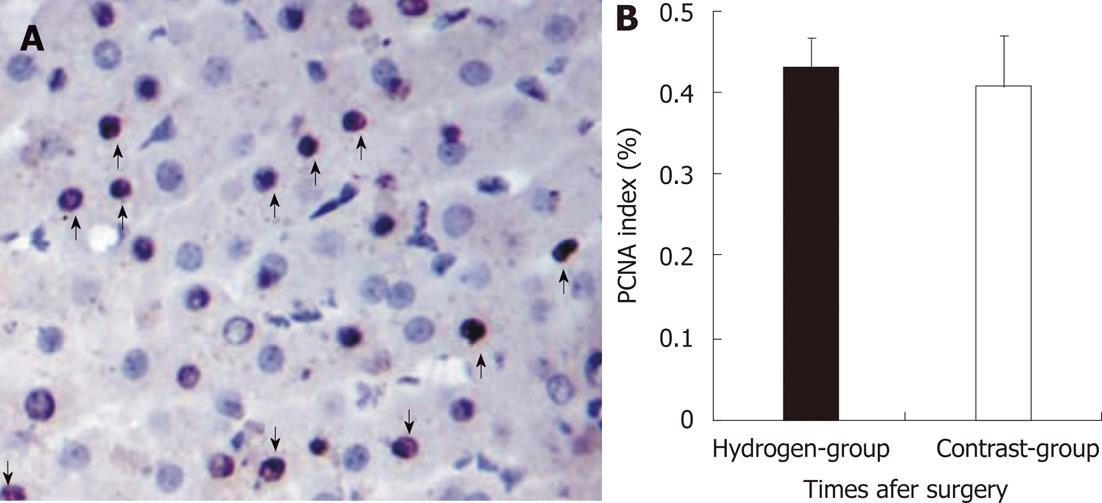
Figure 5 Proliferating cell nuclear antigen immunostaining in liver and the percentage of proliferating cell nuclear antigen stained in two groups.
A: Proliferating cell nuclear antigen (PCNA) staining in liver remnant (arrows, positive cell: × 400); B: Microphotometric evaluation in PCNA stained tissue after hepatotectomy for 3 h between two groups. A bar graph shows the mean ± SD of PCNA stained level (%) in two groups. Each group is represented by the mean of 7 swines.
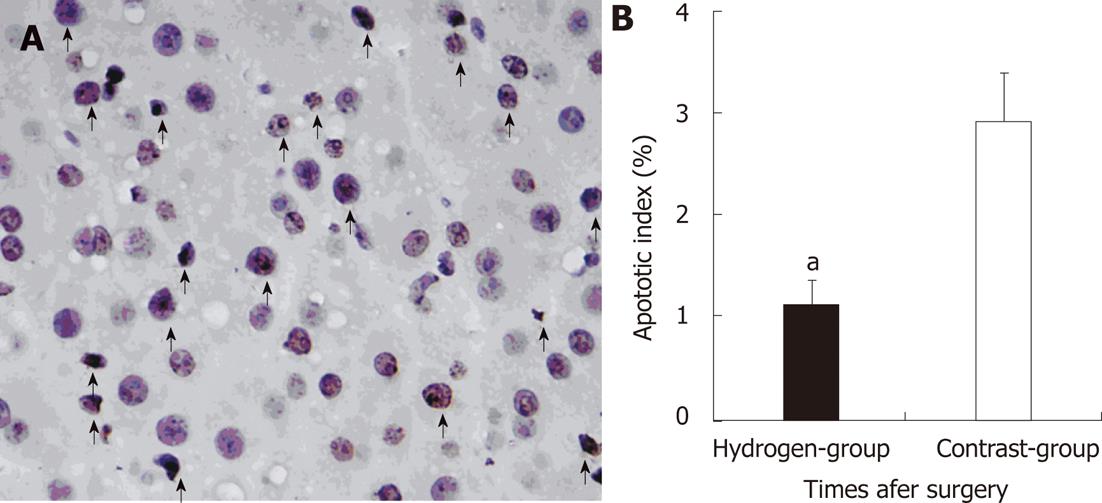
Figure 6 Terminal deoxynucleotidyl transferase-mediated dUTP-biotin nick end labeling staining after hepatectomy and protective effect of H2 against liver apoptotic cell death in two groups.
A: Revealed many terminal deoxynucleotidyl transferase-mediated dUTP-biotin nick end labeling (TUNEL)-positive cells (arrows, identified morphologically by dark brown staining nuclei) in the liver remnant × 400; B: Microphotometric evaluation of apoptotic index (AI) in TUNEL-stained tissue after hepatotectomy for 3 h. A bar graph shows the mean ± SD of AI level (%) in two groups. Each group is represented by the mean of 7 swines. In hydrogen gas treated-group, the AI level was significantly low to Contrast-group (aP < 0.05 vs Contrast-group).
- Citation: Xiang L, Tan JW, Huang LJ, Jia L, Liu YQ, Zhao YQ, Wang K, Dong JH. Inhalation of hydrogen gas reduces liver injury during major hepatotectomy in swine. World J Gastroenterol 2012; 18(37): 5197-5204
- URL: https://www.wjgnet.com/1007-9327/full/v18/i37/5197.htm
- DOI: https://dx.doi.org/10.3748/wjg.v18.i37.5197


