Copyright
©2012 Baishideng Publishing Group Co.
World J Gastroenterol. Oct 7, 2012; 18(37): 5188-5196
Published online Oct 7, 2012. doi: 10.3748/wjg.v18.i37.5188
Published online Oct 7, 2012. doi: 10.3748/wjg.v18.i37.5188
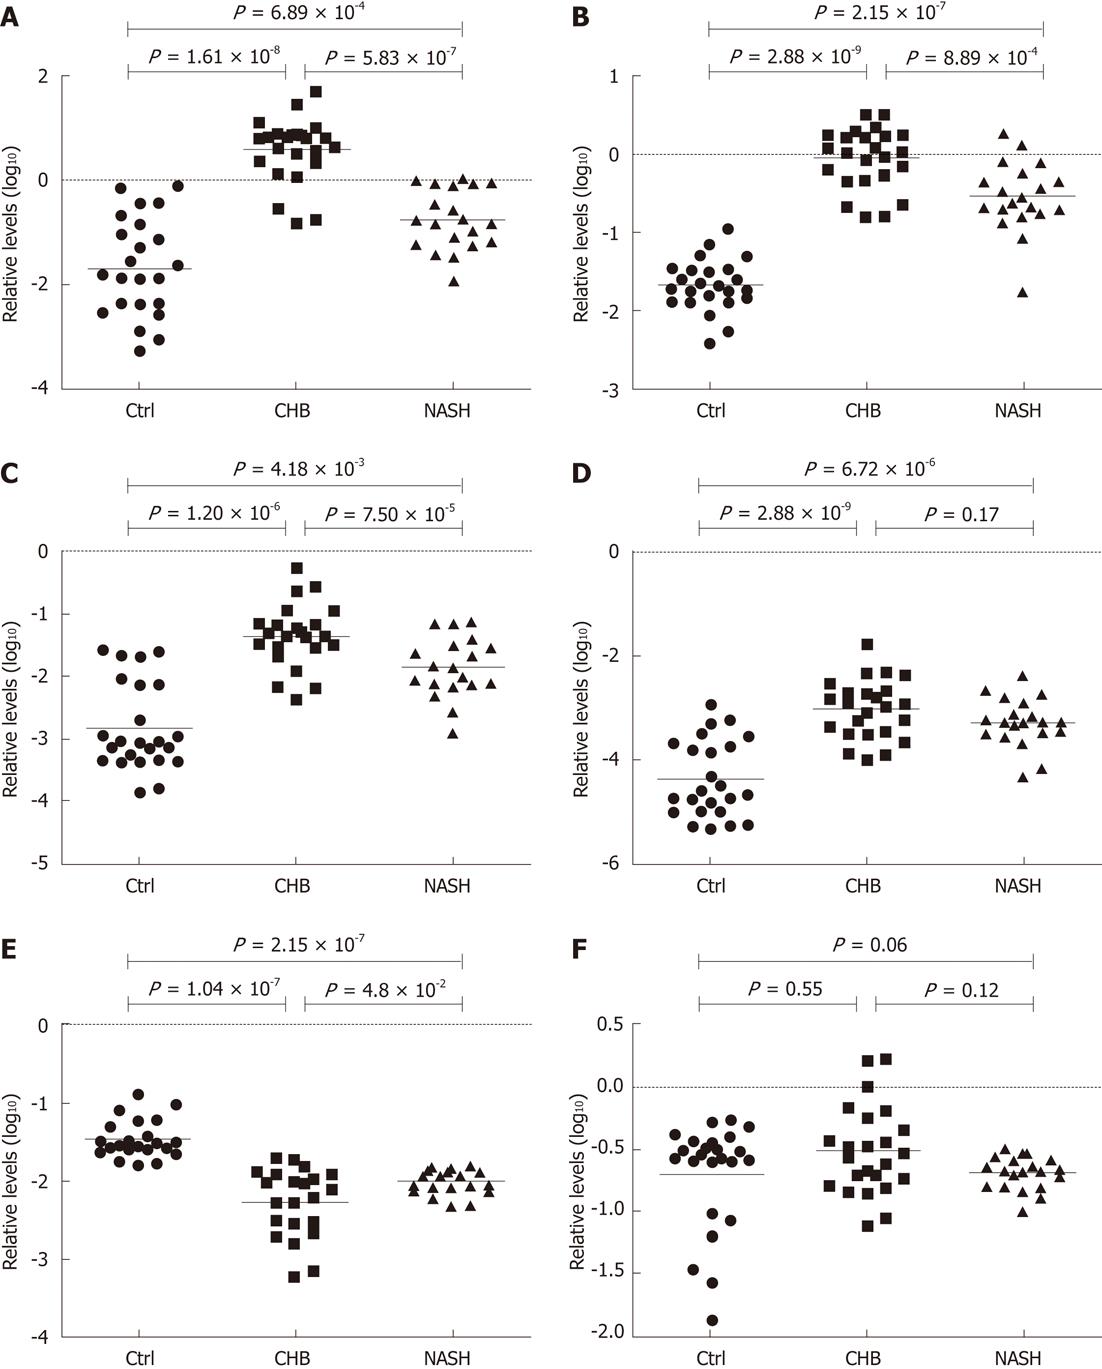
Figure 1 Serum levels of microRNAs in chronic hepatitis B, nonalcohlic steatohepatitis and healthy donors.
The levels of serum miR-122 (A), miR-638 (B), miR-572 (C), miR-575 (D), miR-744 (E) and miR-30c (F) in patients with chronic hepatitis B (CHB) (n = 24), with nonalcohlic steatohepatitis (NASH) (n = 20) and healthy donors (Ctrl) (n = 24) were measured by quantitative reverse transcription polymerase chain reaction. The line at each group represents the median value of indicated miRNA. The values are normalized to miR-24 and shown in log10 scale at y-axis. P values on the top are NASH vs Ctrl, on the left are CHB vs Ctrl and on the right are NASH vs Ctrl.
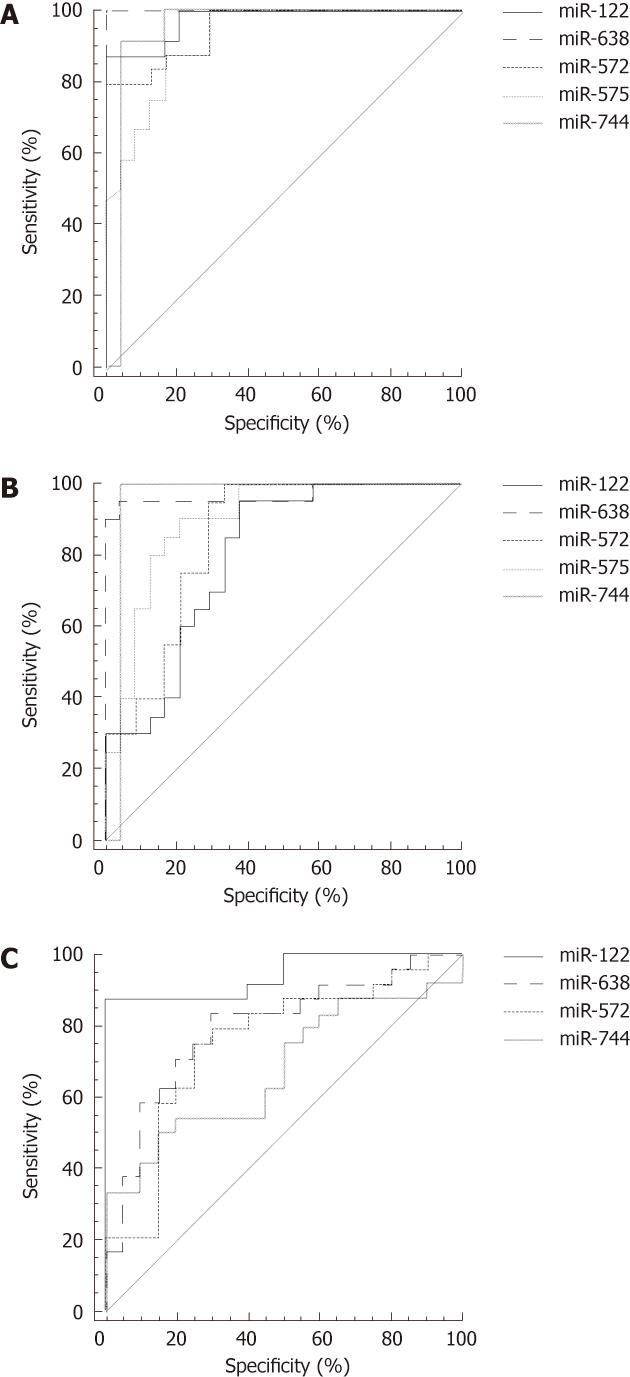
Figure 2 Receiver-operator characteristic curve analyses.
Receiver-operator characteristic curves of the miR-122, -638, -572, -575 and -744 were established to discriminate chronic hepatitis B (CHB) from healthy donor (Ctrl) (A), nonalcohlic steatohepatitis (NASH) from Ctrl (B) and CHB from NASH (C).
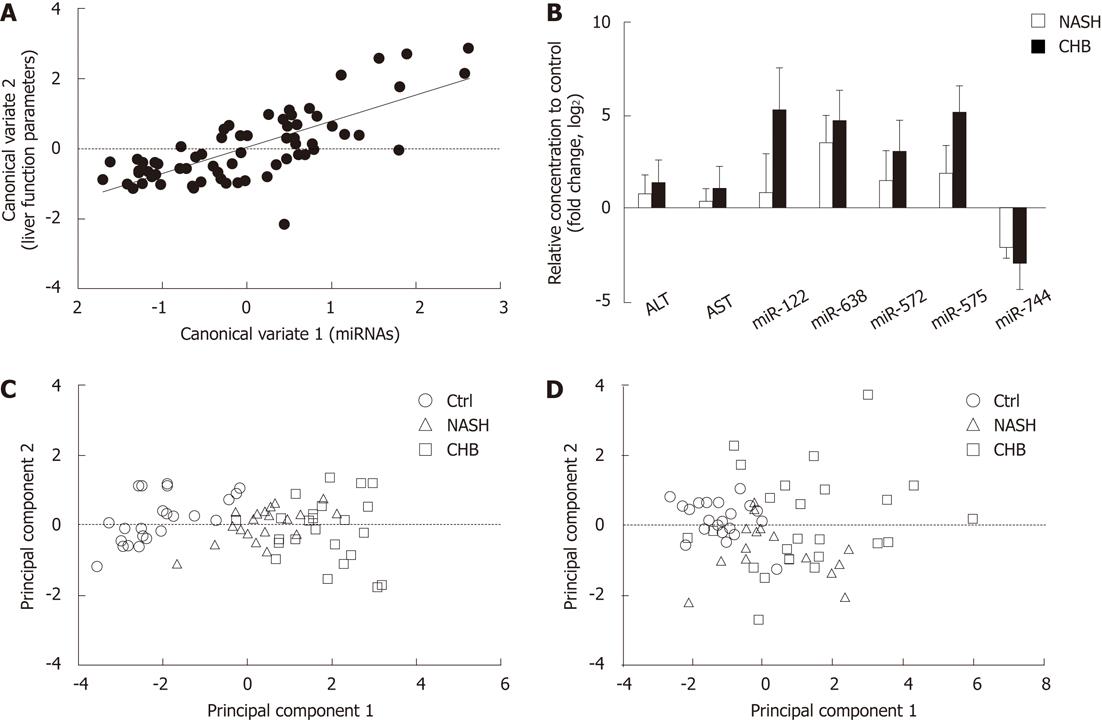
Figure 3 Aberrant levels of serum miR-122, -572, -575, -638 and -744 correlate with the liver pathological parameters.
A: Canonical correlation analysis. The correlation between microRNA (miRNA) variables and liver function parameter variables were calculated by canonical correlation analysis. All the data were log10 transformed. Correlation coefficient r = 0.74 and P < 1.00 × 10⁻⁴. miRNAs: miR-122, -572, -575, -638 and -744; Liver function parameters: Alanine aminotransferase (ALT), aspartate aminotransferase (AST), γ-glutamyltransferase (GGT), alkaline phosphatase (ALP), total bilirubin (TBIL) and bile acid; B: Comparison of serum miRNAs, ALT and AST in chronic hepatitis B (CHB) and nonalcohlic steatohepatitis (NASH). The comparison among the levels of ALT, AST, miR-122, -572, -575, -638 and -744 in serum samples collected from patients with NASH and CHB (indicated on x-axis). The relative change of ALT, AST and miRNA expression levels were expressed ratio in log2 compared with healthy control (Ctrl) (indicated on y-axis). The values of ALT, AST and miRNA fold change are the average of samples from CHB (n = 24), NASH (n = 20) and Ctrls (n = 24), and the SD is shown as an error bar; C, D: Scatter plot of principal components analysis. All the data were log10 transformed to carry out analysis. Scatter plot of first two principal component of miRNAs variables including miR-122, -572, -575, -638 and -744 (C), and liver function parameters including ALT, AST, GGT, ALP, TBIL and bile acid (D) in CHB (n = 24), NASH (n = 20) and Ctrls (n = 24).
- Citation: Zhang H, Li QY, Guo ZZ, Guan Y, Du J, Lu YY, Hu YY, Liu P, Huang S, Su SB. Serum levels of microRNAs can specifically predict liver injury of chronic hepatitis B. World J Gastroenterol 2012; 18(37): 5188-5196
- URL: https://www.wjgnet.com/1007-9327/full/v18/i37/5188.htm
- DOI: https://dx.doi.org/10.3748/wjg.v18.i37.5188


