Copyright
©2012 Baishideng Publishing Group Co.
World J Gastroenterol. Sep 28, 2012; 18(36): 5065-5071
Published online Sep 28, 2012. doi: 10.3748/wjg.v18.i36.5065
Published online Sep 28, 2012. doi: 10.3748/wjg.v18.i36.5065
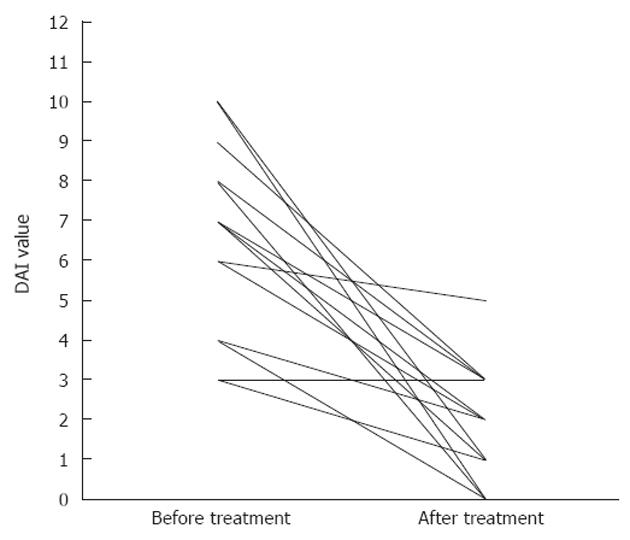
Figure 1 Disease activity index before and after treatment in all patients.
In the left part of the graph, there are disease activity index (DAI) values for every patient affected by ulcerative colitis or Crohn's disease at enrollment. In the right part of the graph, there are DAI values for every patient after treatment.
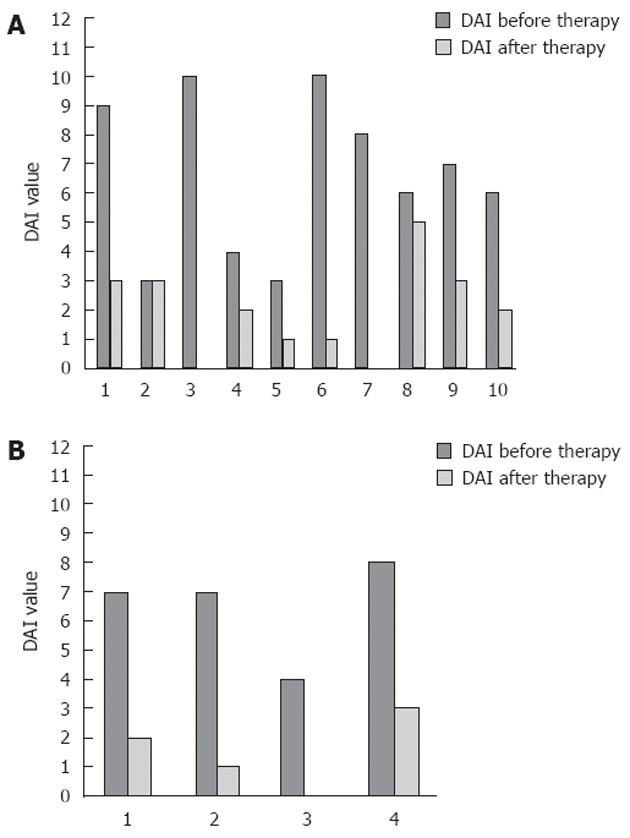
Figure 2 Disease activity index in patients affected by ulcerative colitis and Crohn’s disease.
A: The dark grey columns show disease activity index (DAI) values before treatment, while the light grey columns show DAI values after treatment in patients with ulcerative colitis; B: The dark grey columns show DAI values before treatment, while the light grey columns show DAI values after treatment in patients with Crohn’s disease.
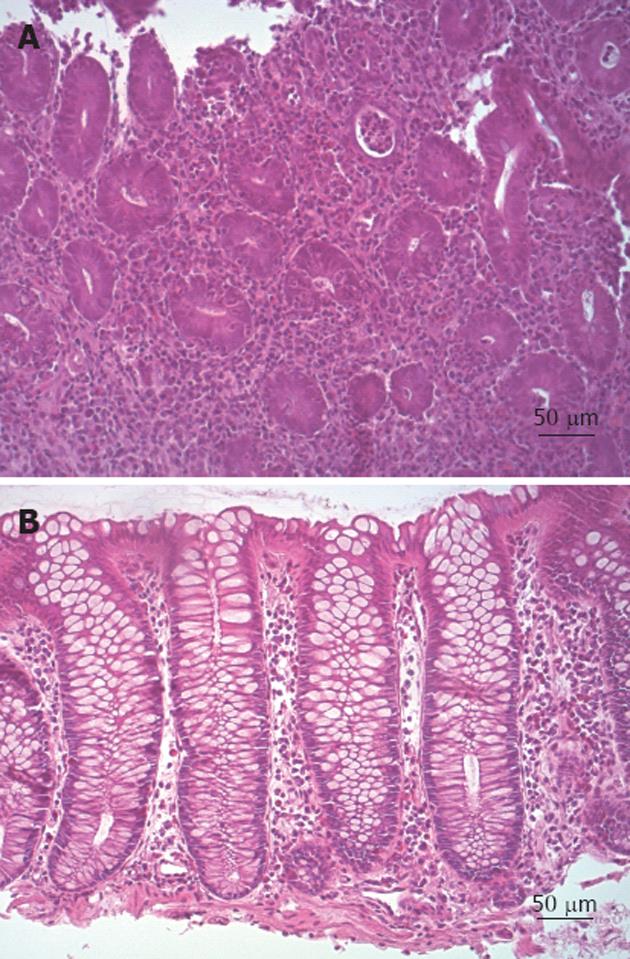
Figure 3 Histological samples before and after therapy.
A: Biopsy specimen showing crypt abscess and perycriptitis (histological grade 2); B: Biopsy specimen morphologically indistinguishable from normal intestinal mucosa (histological grade 0).
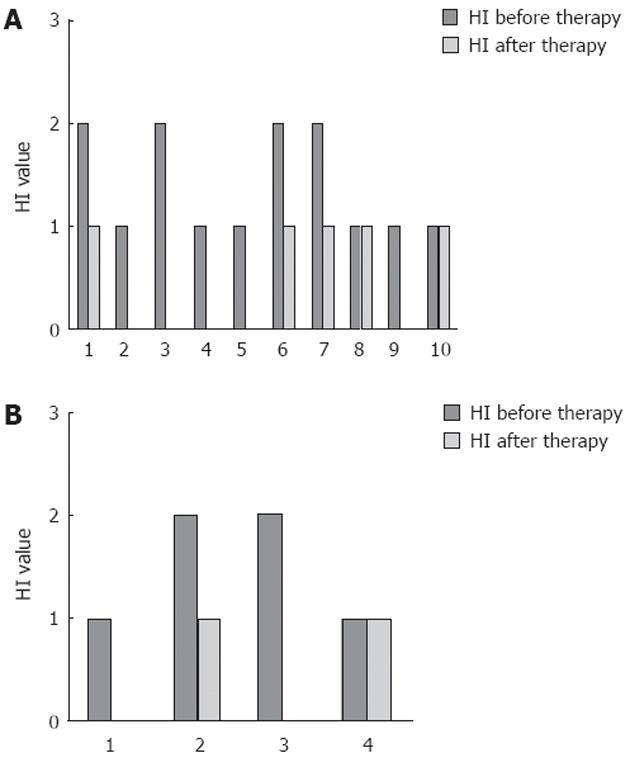
Figure 4 Histological index in patients affected by ulcerative colitis and Crohn’s disease.
A: The dark grey columns show histological index (HI) values before treatment, while the light grey columns show HI values after treatment in patients with ulcerative colitis; B: The dark grey columns show HI values before treatment, while the light grey columns show HI values after treatment in patients with Crohn’s disease.
- Citation: Merra G, Gasbarrini G, Laterza L, Pizzoferrato M, Poscia A, Scaldaferri F, Arena V, Fiore F, Cittadini A, Sgambato A, Franceschi F, Gasbarrini A. Propionyl-L-carnitine hydrochloride for treatment of mild to moderate colonic inflammatory bowel diseases. World J Gastroenterol 2012; 18(36): 5065-5071
- URL: https://www.wjgnet.com/1007-9327/full/v18/i36/5065.htm
- DOI: https://dx.doi.org/10.3748/wjg.v18.i36.5065


