Copyright
©2012 Baishideng Publishing Group Co.
World J Gastroenterol. Sep 28, 2012; 18(36): 5042-5050
Published online Sep 28, 2012. doi: 10.3748/wjg.v18.i36.5042
Published online Sep 28, 2012. doi: 10.3748/wjg.v18.i36.5042
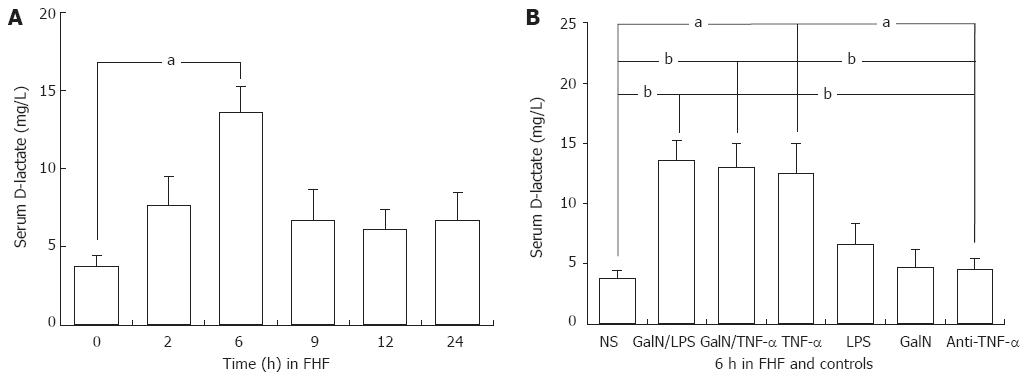
Figure 1 Systemic blood D(-)-lactate levels in the mouse model of fulminant hepatic failure and controls.
Systemic blood D (-)-lactate levels 2, 6, 9, 12 and 24 h after injection in D-galactosamine (GalN)/lipopolysaccharide (LPS)-treated mice, and 6 h after injection in the saline, GalN, LPS, tumor necrosis factor alpha (TNF-α), anti-TNF-α immunoglobulin G antibody-pretreated groups. n = 5 rats for each time point. NS: Normal saline; FHF: Fulminant hepatic failure. The level of significance was set at aP < 0.05, bP < 0.01 vs baseline (NS group). Data are reported as the mean ± SD.
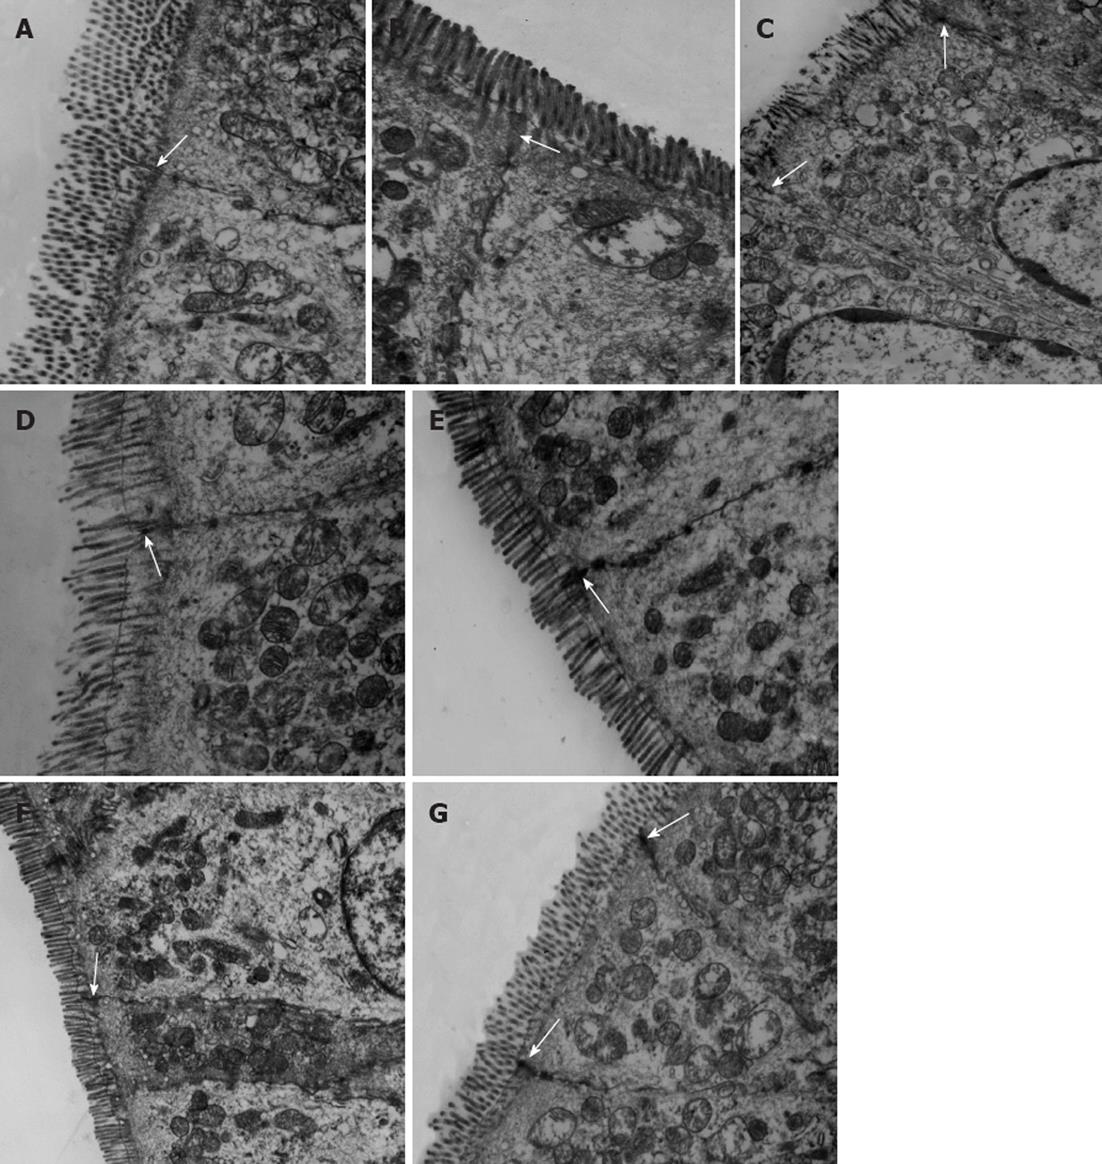
Figure 2 Transmission electron microscopy of mouse intestine (8000×).
Transmission electron microscopy of mice intestine from the D-galactosamine (GalN)/lipopolysaccharide (LPS) and GalN/tumor necrosis factor alpha (TNF-α) groups (A and B), the control groups (C, D, E and F), and the group that received antibody prior to fulminant hepatic failure induction (G) (8000×). A: At 6 h after injection in the GalN/LPS group. The mitochondria of the endothelial cells were loose. Tight junctions (TJs) (arrow) were disrupted. Organelles were swollen and had reduced electron density; some microvilli were loose. A TJ (arrow) was disrupted; B: At 6 h after injection in the GalN/TNF-α group, mitochondria, organelles and microvilli were similar to A. A TJ (arrow) was disrupted; C: The GalN control group; D: The LPS control group. Epithelial cells were slightly shrunken and TJs (arrow) were intact; E: TNF-α-treated group. TJ (arrow) was intact; F: The normal saline control group. Epithelial cells and TJ (arrow) were intact; G: Anti-TNF-α antibody and the GalN/LPS group. Epithelial cells were slightly shrunken and TJs (arrows) between endothelial cells were intact.
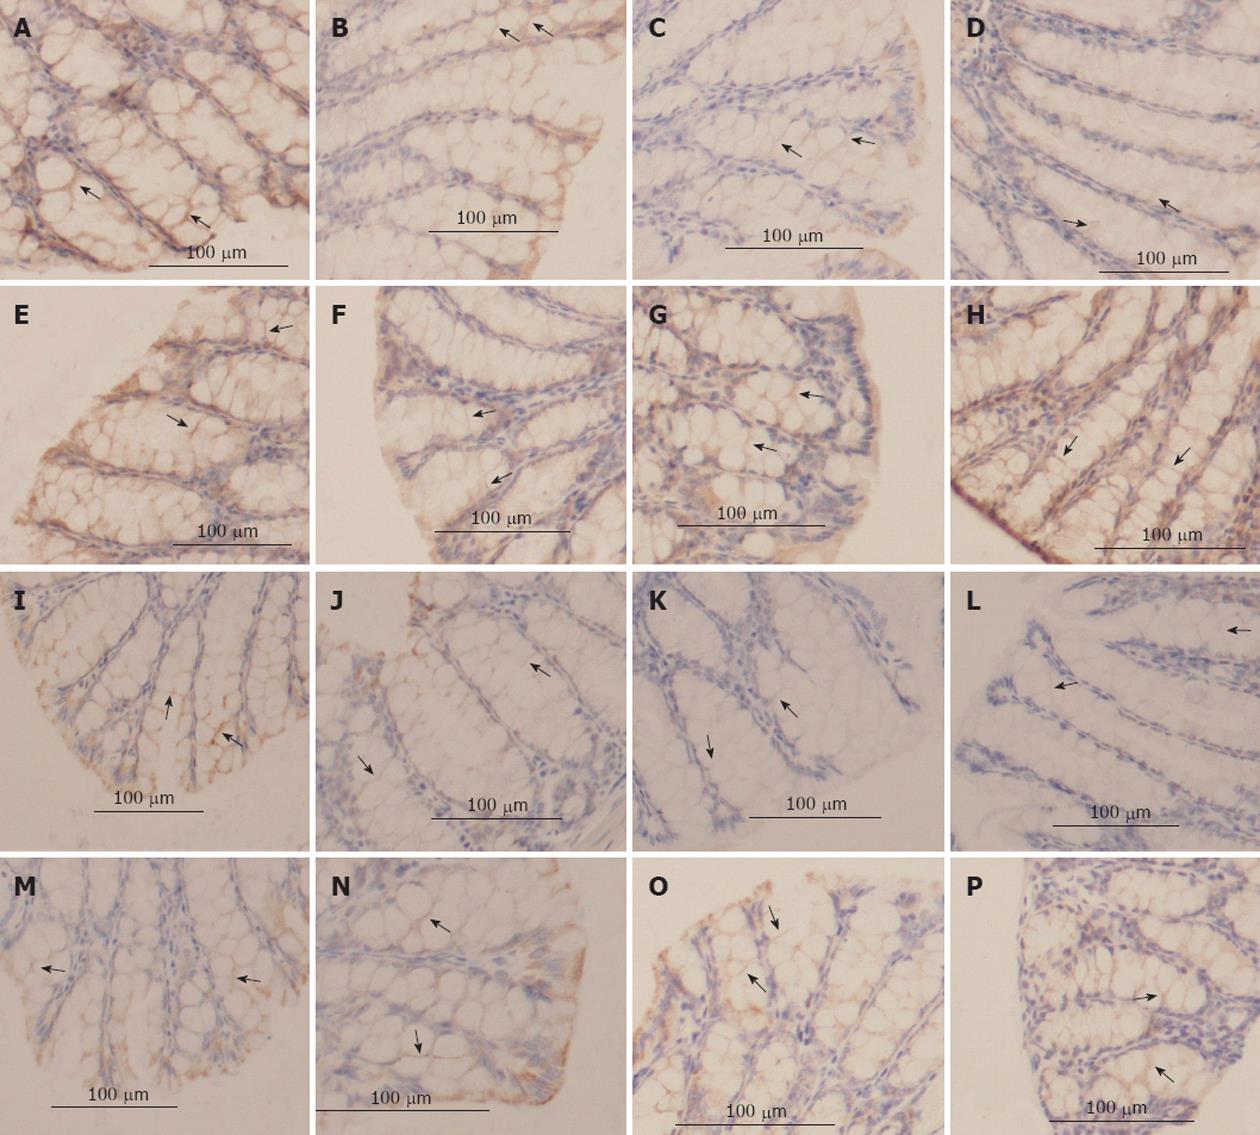
Figure 3 The tight junction proteins, occludin and claudin-1 determined by immunohistochemistry (400×).
A: Occludin staining in the saline group; B-D: Occludin staining 2 h, 6 h, and 9 h after injection in the D-galactosamine (GalN)/lipopolysaccharide (LPS)-treated mice; E-H: Occludin staining 6 h after injection in the anti-tumor necrosis factor alpha (TNF-α) immunoglobulin G (IgG) antibody pretreated group within the TNF-α-treated group; the LPS-treated group and the D-GalN-treated group, respectively; I: Claudin-1 staining in the saline group; J-L: Claudin-1 staining 2, 6, and 9 h after injection in the GalN/LPS-treated mice; M-P: Claudin-1 staining 6 h after injection in the anti-TNF-α IgG antibody pretreated group, the TNF-α-treated group, the LPS-treated group and the D-GalN-treated group, respectively. The mucosal tissue sections were double-labeled for proteins (brown color). Labeled sections were analyzed immunohisto-chemically. Decreased protein staining in the epithelial cells were observed at 2-9 h after injection in the GalN/LPS-treated mice and the TNF-α-treated group, and was absent in the other controls and the antibody pretreated group.
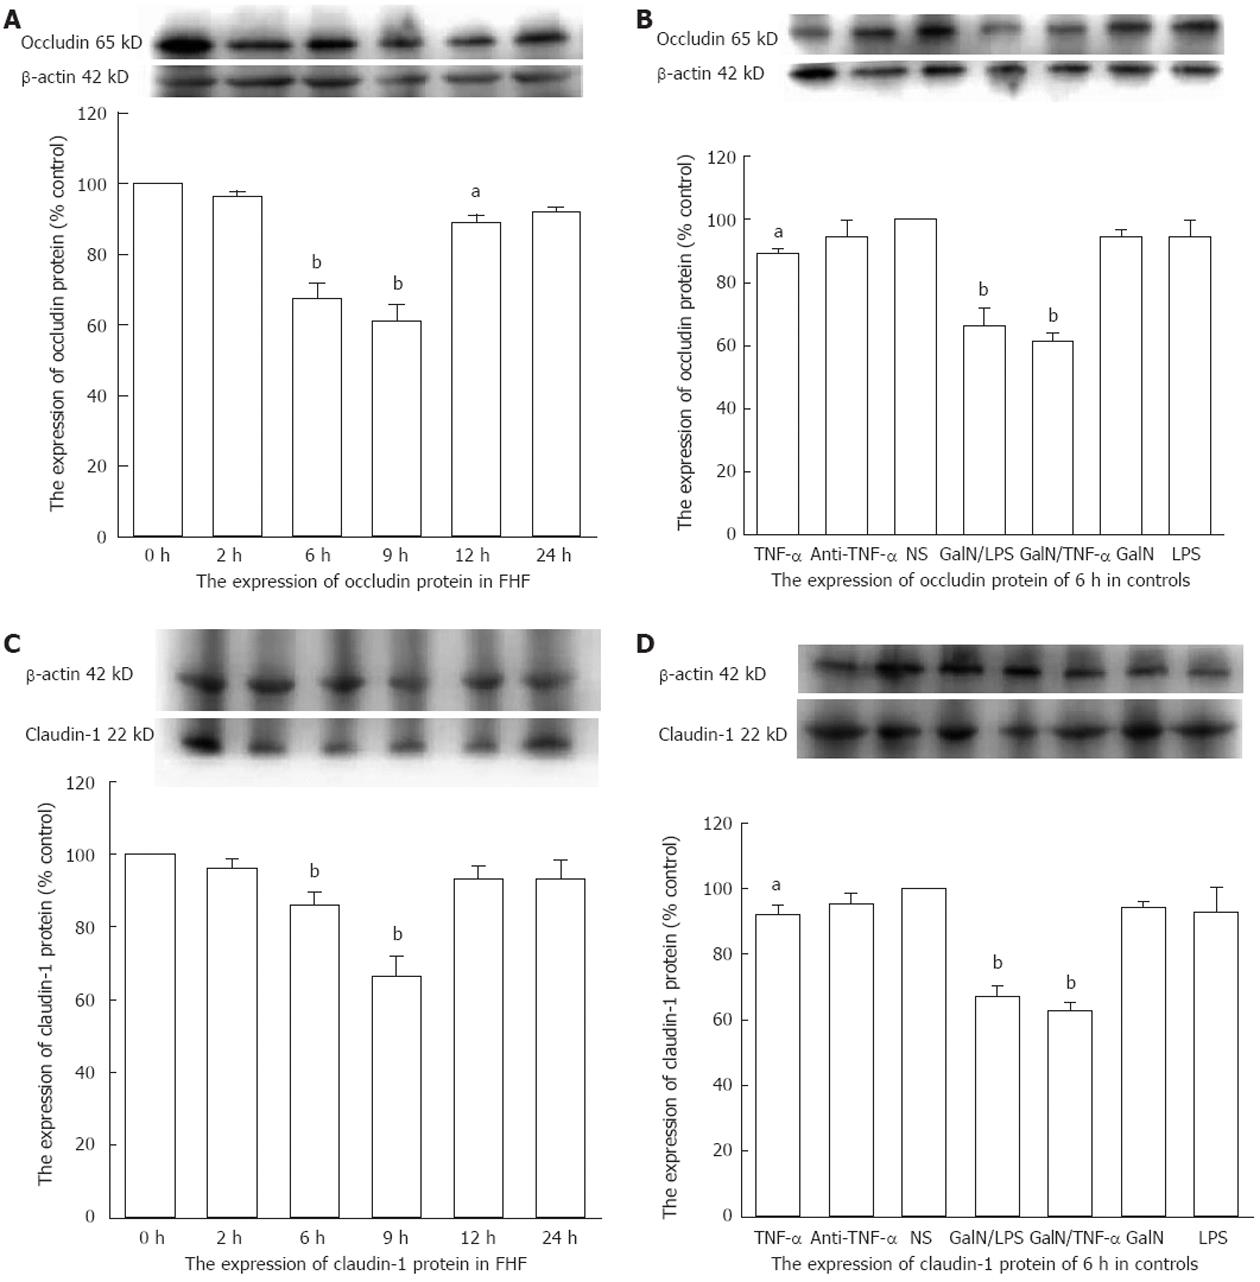
Figure 4 Mucosal colonic tissues from fulminant hepatic failure and control mice were analyzed for the protein expression of occludin and claudin-1 by Western blotting analysis.
A: Occludin expression decreased significantly 6, 9 and 12 h after D-galactosamine (GalN)/lipopolysaccharide (LPS) injection; B: Occludin expression decreased significantly 6 h after injection in the GalN/ tumor necrosis factor alpha (TNF-α)- and TNF-α-treated mice; C: Claudin-1 expression decreased significantly 6 h and 9 h after GalN/LPS injection; D: Claudin-1 expression decreased significantly 6 h after injection in the GalN/TNF-α- and TNF-α-treated mice. NS: Normal saline; FHF: Fulminant hepatic failure. aP < 0.05, bP < 0.01 vs baseline. Data are reported as the mean ± SD.
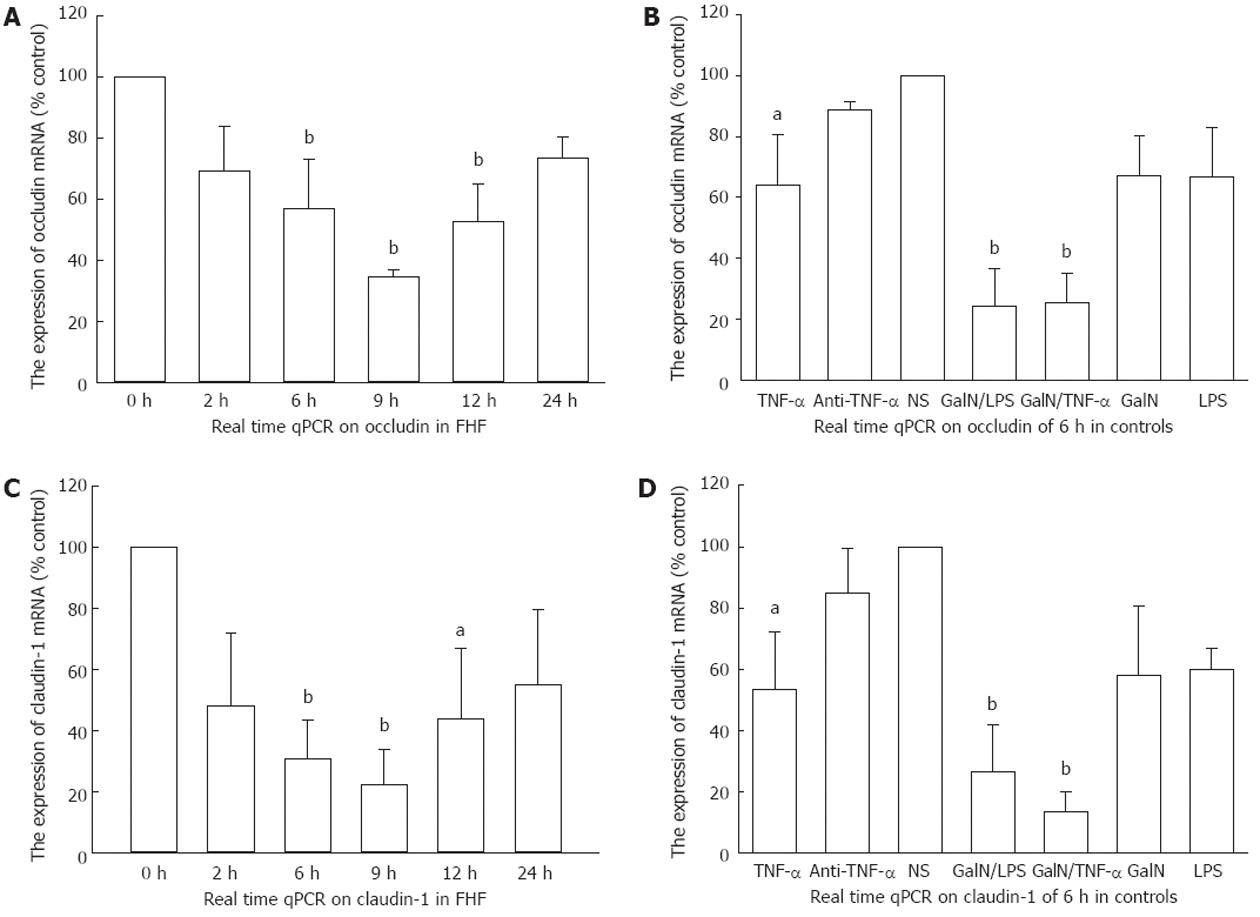
Figure 5 Real-time quantitative reverse transcription-polymerase chain reaction for occludin and claudin-1 mRNA in the fulminant hepatic failure groups and the control groups.
A: Occludin significantly decreased 6 h, 9 h and 12 h after D-galactosamine (GalN)/lipopolysaccharide (LPS) injections in GalN/LPS-treated mice; B: Occludin markedly decreased 6 h after injection in the GalN/tumor necrosis factor alpha (TNF-α) or TNF-α treated mice; C: Claudin-1 significantly decreased 6 h, 9 h and 12 h after GalN/LPS injections in the GalN/LPS treated mice; D: Claudin-1 markedly decreased 6 h after injection in the GalN/TNF-α- or TNF-α-treated mice. NS: Normal saline; FHF: Fulminant hepatic failure; qPCR: Quantitative polymerase chain reaction. aP < 0.05, bP < 0.01 vs baseline. Data are reported as the mean ± SD.
- Citation: Li GZ, Wang ZH, Cui W, Fu JL, Wang YR, Liu P. Tumor necrosis factor alpha increases intestinal permeability in mice with fulminant hepatic failure. World J Gastroenterol 2012; 18(36): 5042-5050
- URL: https://www.wjgnet.com/1007-9327/full/v18/i36/5042.htm
- DOI: https://dx.doi.org/10.3748/wjg.v18.i36.5042


