Copyright
©2012 Baishideng Publishing Group Co.
World J Gastroenterol. Sep 14, 2012; 18(34): 4736-4743
Published online Sep 14, 2012. doi: 10.3748/wjg.v18.i34.4736
Published online Sep 14, 2012. doi: 10.3748/wjg.v18.i34.4736
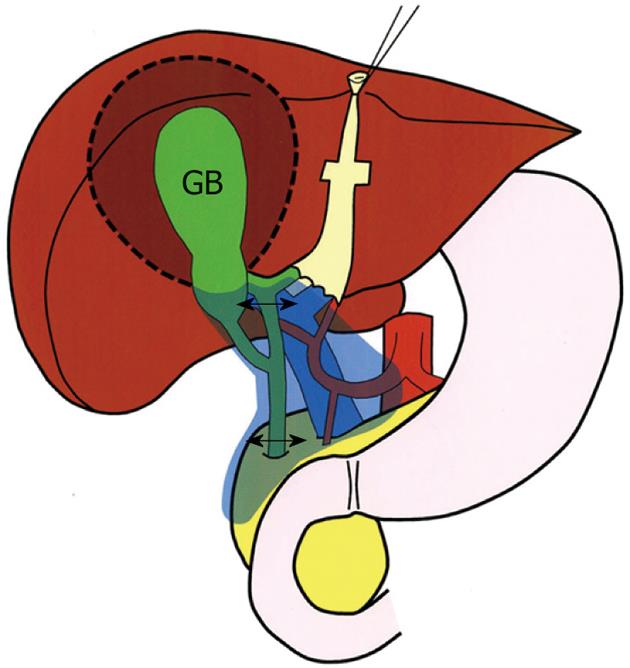
Figure 1 "Extended" radical cholecystectomy for gallbladder cancer.
The dashed line indicates the scope of wedge resection of the gallbladder fossa (about 2 cm in thickness or more). The double-headed arrows indicate lines of division of the extrahepatic bile duct. The pale blue area indicates the extent of regional lymph node dissection, which achieves en bloc harvesting of both the first-echelon nodes (cystic duct and pericholedochal node groups) and the second-echelon nodes (posterosuperior pancreaticoduodenal, retroportal, right celiac, and hepatic artery node groups)[11,15]. GB: Gallbladder.
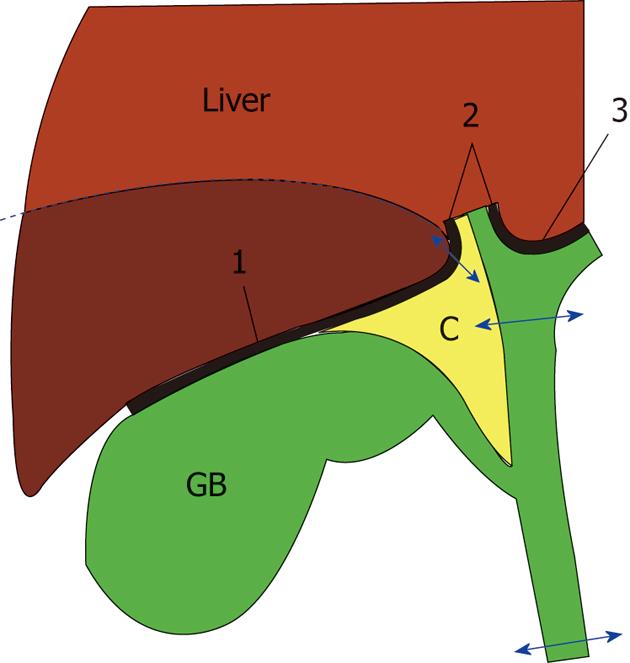
Figure 2 Wedge resection of the gallbladder fossa in "extended" radical cholecystectomy.
The dashed line indicates the line of hepatic parenchymal division. The short double-headed arrow indicates the line of division of the cystic plate. The long double-headed arrows indicate lines of division of the extrahepatic bile duct. At the end of parenchymal division, the cystic plate is identified as a fibrous plate connecting with the right portal pedicle, and then divided at its base. Arabic numerals indicate the plate system of the liver (1: Cystic plate; 2: The dense fibrous sheath encircling the right portal pedicle; 3: Hilar plate). GB: Gallbladder; C: The triangle of Calot.
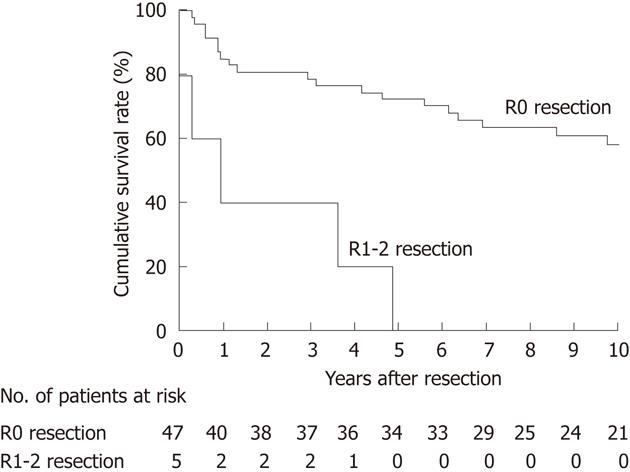
Figure 3 Kaplan-Meier overall survival estimates stratified for residual tumor status (R) across the study cohort (52 patients).
The median overall survival (OS) was not reached with a 5-year OS rate of 72% in patients undergoing an R0 resection, whereas it was 11 mo with a 5-year OS rate of 0% in patients undergoing an R1-2 resection (P < 0.001).
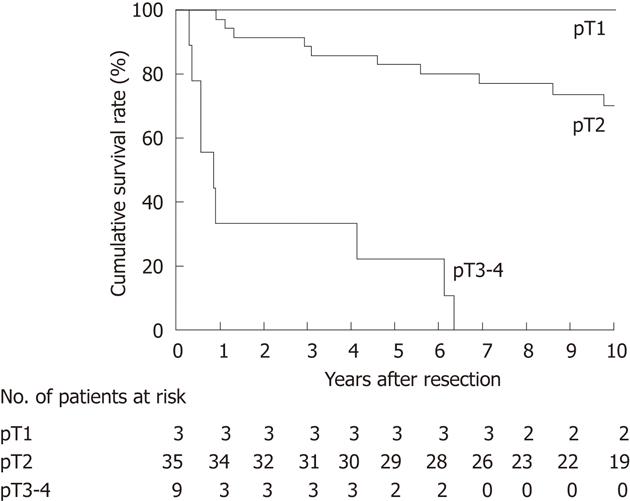
Figure 4 Kaplan-Meier overall survival estimates stratified for pathological T classification in 47 patients who underwent an no residual tumor resection.
The median overall survival (OS) was not reached with a 5-year OS rate of 100% in patients with pathological T1 (pT1) disease. The median OS was not reached with a 5-year OS rate of 83% in pT2 patients, whereas it was 10 mo with a 5-year OS rate of 22% in pT3-4 patients. OS differed significantly among the groups (P < 0.001).
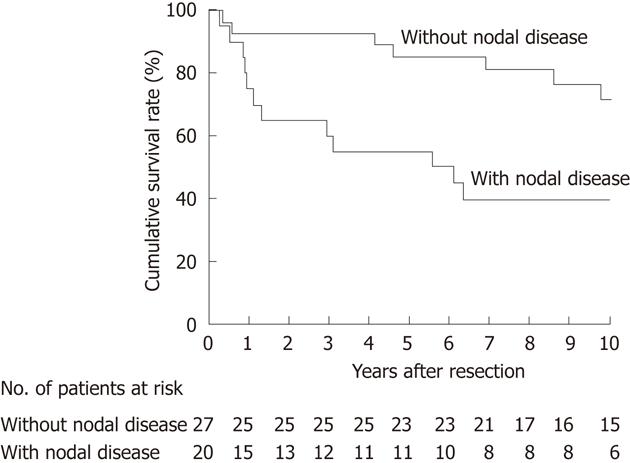
Figure 5 Kaplan-Meier overall survival estimates stratified for nodal status in 47 patients who underwent an no residual tumor resection.
The median overall survival (OS) was not reached with a 5-year OS rate of 85% in patients without nodal disease, whereas it was 67 mo with a 5-year OS rate of 55% in patients with nodal disease (P = 0.010).
- Citation: Shirai Y, Sakata J, Wakai T, Ohashi T, Hatakeyama K. "Extended" radical cholecystectomy for gallbladder cancer: Long-term outcomes, indications and limitations. World J Gastroenterol 2012; 18(34): 4736-4743
- URL: https://www.wjgnet.com/1007-9327/full/v18/i34/4736.htm
- DOI: https://dx.doi.org/10.3748/wjg.v18.i34.4736


