Copyright
©2012 Baishideng Publishing Group Co.
World J Gastroenterol. Sep 7, 2012; 18(33): 4585-4592
Published online Sep 7, 2012. doi: 10.3748/wjg.v18.i33.4585
Published online Sep 7, 2012. doi: 10.3748/wjg.v18.i33.4585
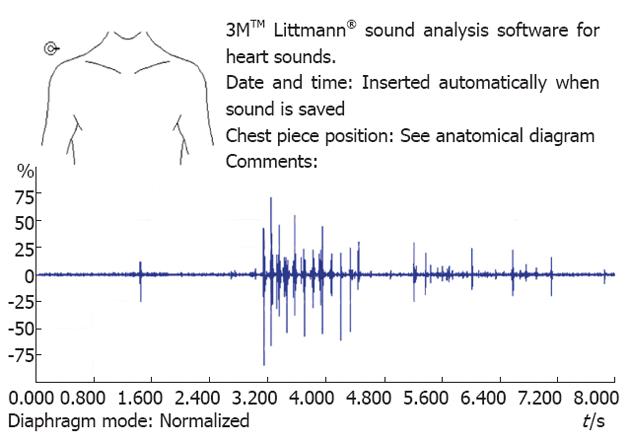
Figure 1 Example of bowel sound recording displayed in the “waveform” view.
The y-axis indicates the relative sound amplitude and the x-axis indicates recording time elapsed in seconds. This recording was taken from a patient with a small bowel obstruction. Note the isolated sound on the left side followed by two clusters of sound in the middle and on right side of the strip.
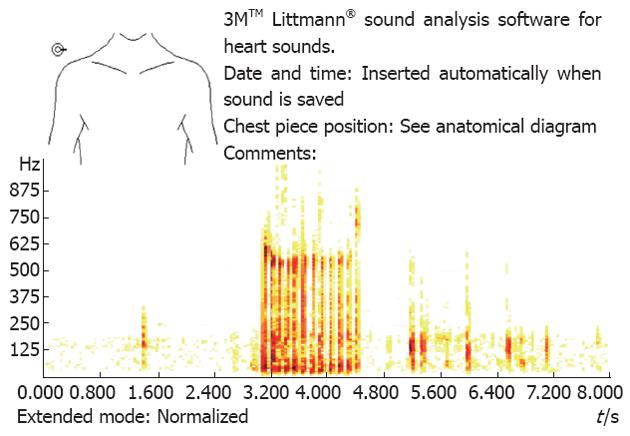
Figure 2 Example of bowel sound recording displayed in the “spectrum” view.
This chart shows the sound frequency spectrum and the relative intensity of each sound frequency (darker colour indicates higher sound intensity at the frequency indicated along the y-axis) for the same recording used for Figure 1.
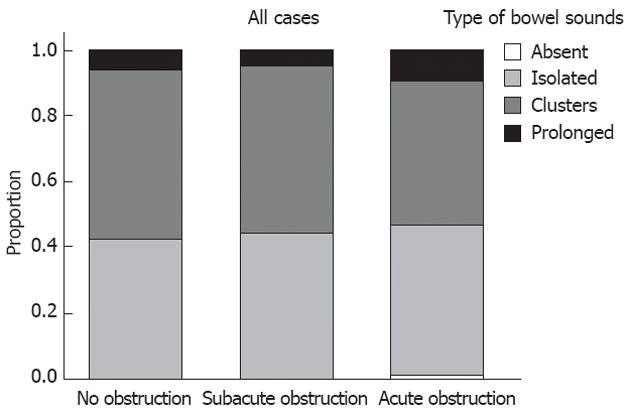
Figure 3 Distribution of different types of bowel sounds recorded for patients with no obstruction, subacute obstruction, and acute obstruction.
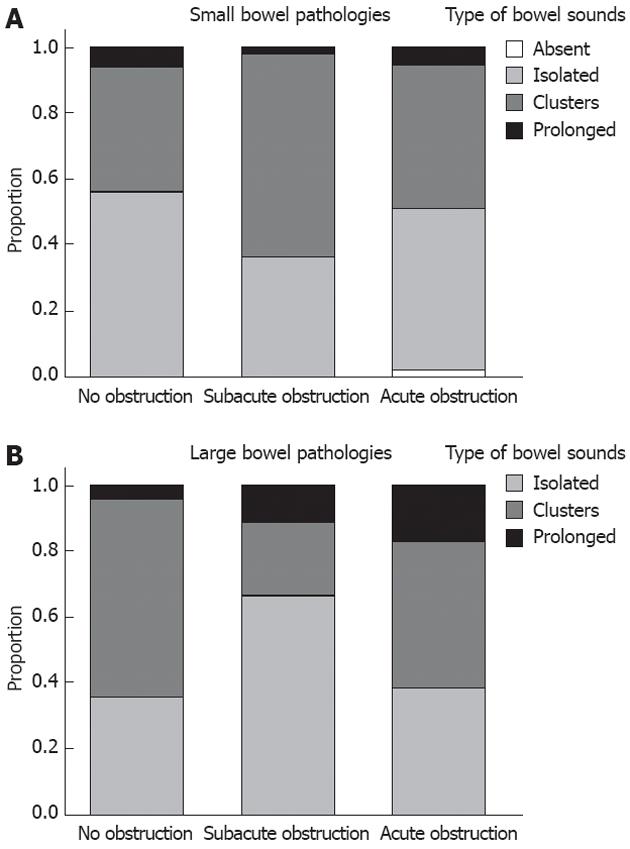
Figure 4 Distribution of different types of bowel sounds recorded for patients with small bowel pathologies (A) and large bowel pathologies (B).
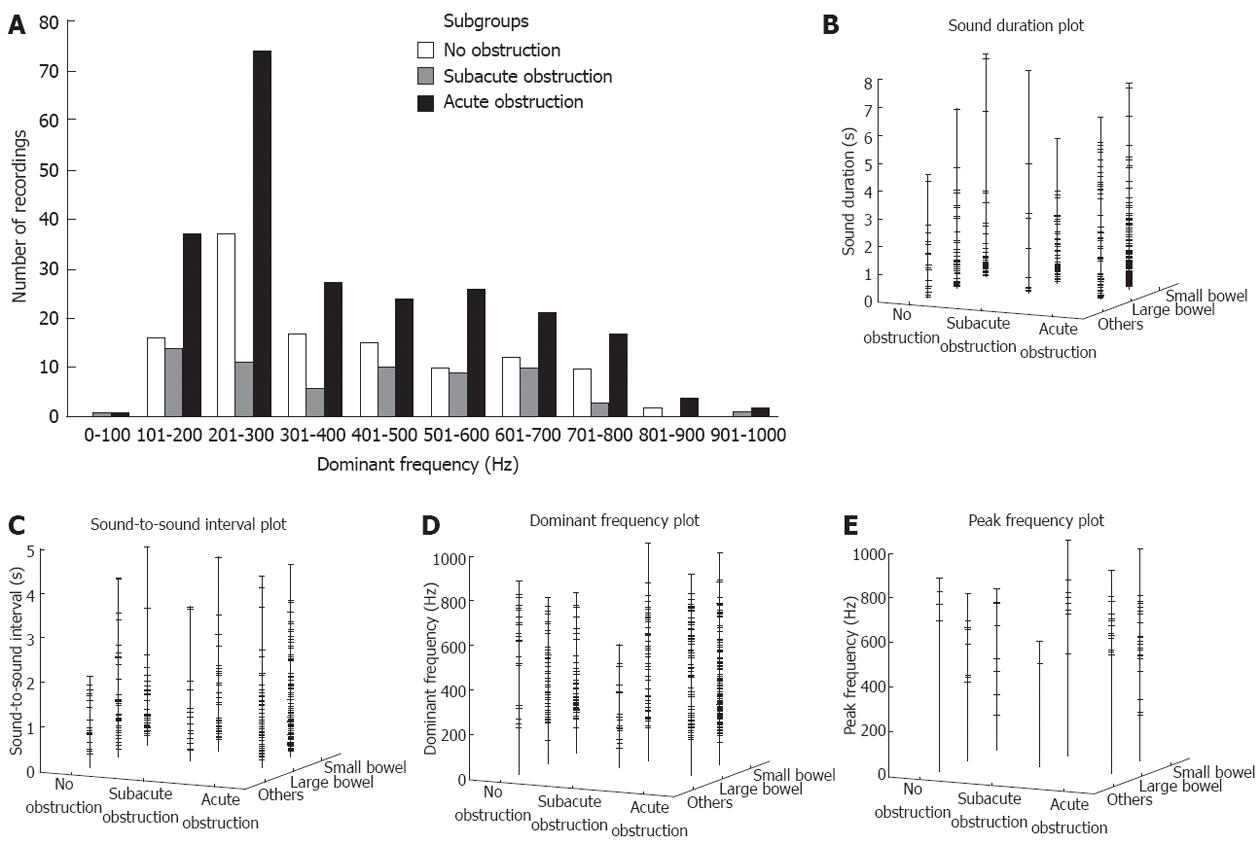
Figure 5 Distribution of the dominant frequencies of bowel sounds (A), sound duration (B), sound-to-sound interval (C), dominant frequency (D), and peak frequency (E) in patients with no obstruction, subacute obstruction, and acute obstruction, etc.
- Citation: Ching SS, Tan YK. Spectral analysis of bowel sounds in intestinal obstruction using an electronic stethoscope. World J Gastroenterol 2012; 18(33): 4585-4592
- URL: https://www.wjgnet.com/1007-9327/full/v18/i33/4585.htm
- DOI: https://dx.doi.org/10.3748/wjg.v18.i33.4585


