Copyright
©2012 Baishideng Publishing Group Co.
World J Gastroenterol. Aug 21, 2012; 18(31): 4191-4198
Published online Aug 21, 2012. doi: 10.3748/wjg.v18.i31.4191
Published online Aug 21, 2012. doi: 10.3748/wjg.v18.i31.4191
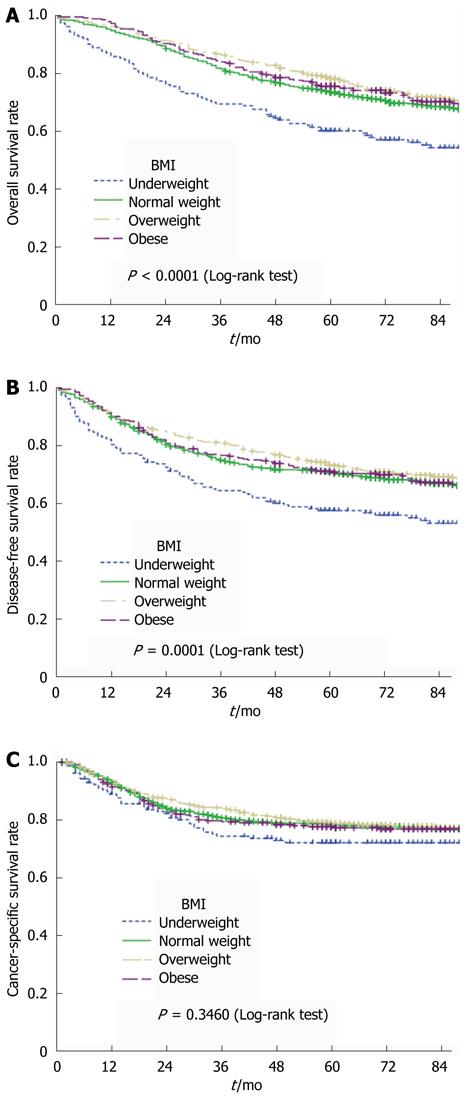
Figure 1 Overall survival curves (A) , disease-free survival curves (B) and cancer-specific survival curves (C) relative to body mass index category using the Kaplan-Meier method, and comparison using the log-rank test.
BMI: Body mass index.
- Citation: Chin CC, Kuo YH, Yeh CY, Chen JS, Tang R, Changchien CR, Wang JY, Huang WS. Role of body mass index in colon cancer patients in Taiwan. World J Gastroenterol 2012; 18(31): 4191-4198
- URL: https://www.wjgnet.com/1007-9327/full/v18/i31/4191.htm
- DOI: https://dx.doi.org/10.3748/wjg.v18.i31.4191


