Copyright
©2012 Baishideng Publishing Group Co.
World J Gastroenterol. Aug 14, 2012; 18(30): 3955-3961
Published online Aug 14, 2012. doi: 10.3748/wjg.v18.i30.3955
Published online Aug 14, 2012. doi: 10.3748/wjg.v18.i30.3955
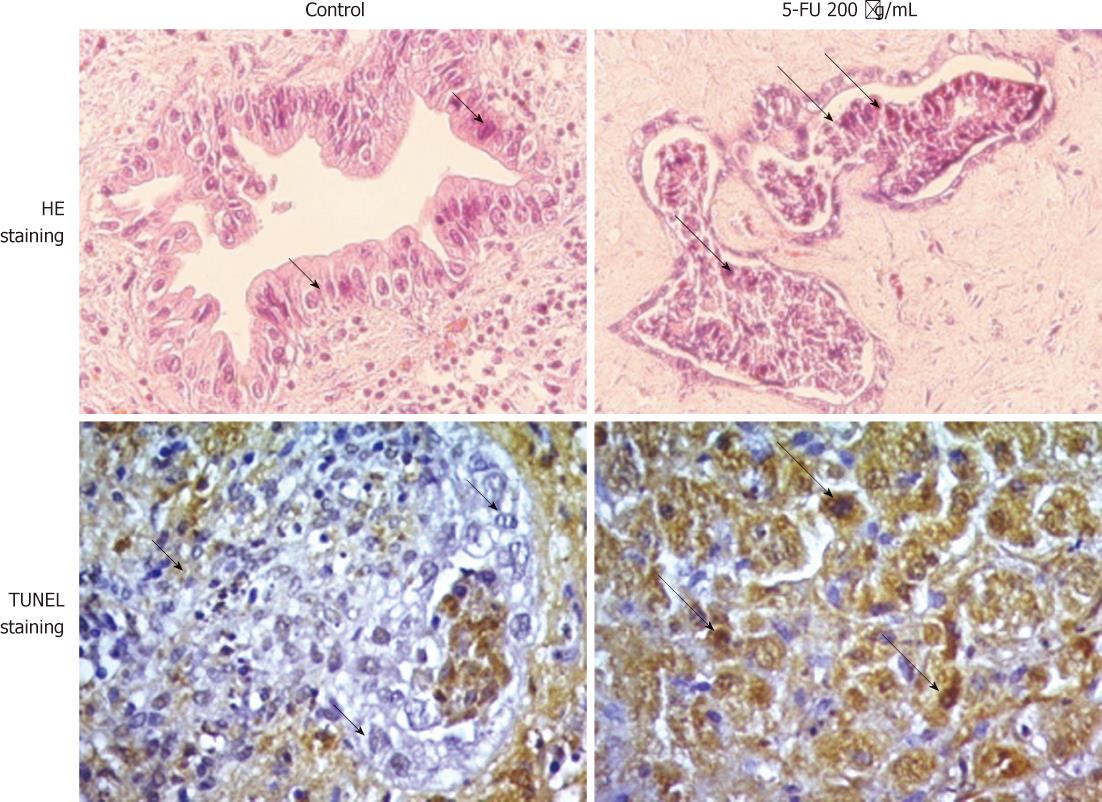
Figure 1 Photomicrographs (40 ×) of hematoxylin and eosin-stained and terminal deoxynucleotide transferase-mediated dUTP nick-end label-stained sections of cholangiocarcinoma tissues cultured on collagen gel sponges for 4 d in the absence or presence of 5-fluorouracil.
Tumor cells with anaplastic characteristics showing hyperchromatic nuclei/cytoplasm are indicated with short arrows. Cells with eosinophilic cytoplasm with shrunken (condensed) nuclei (pyknotic nuclei) and fragmented nuclei (karyorrhexis) are indicated with long arrows. 5-FU: 5-fluorouracil; HE: Hematoxylin and eosin; TUNEL: Terminal deoxynucleotide transferase-mediated dUTP nick-end label
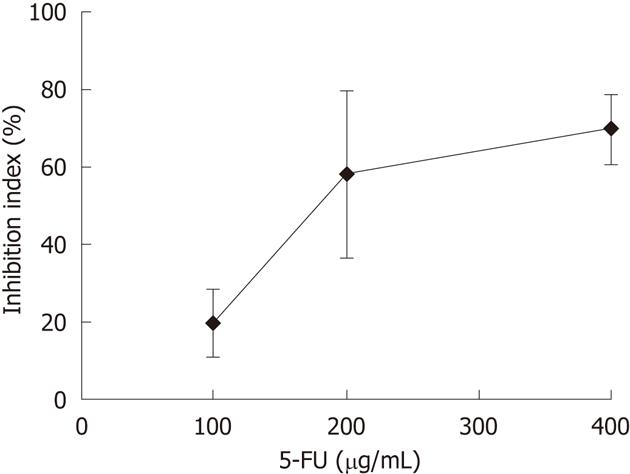
Figure 2 Dose-response-curve of cholangiocarcinoma tissues to 5-fluorouracil.
Sensitivities of five cholangiocarcinoma tissues to 5-fluorouracil (5-FU) are shown as the percent of inhibition index (% I.I.), which was evaluated at doses of 100 μg/mL, 200 μg/mL, and 400 μg/mL using histoculture drug response assay. Data are the mean ± SD of two independent experiments.
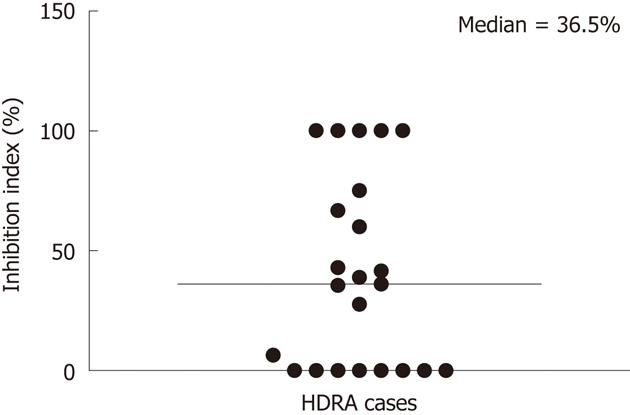
Figure 3 Distribution of percent of inhibition index of 23 cholangiocarcinoma tissues to 200 μg/mL 5-fluorouracil.
Sensitivities of 23 cholangiocarcinoma (CCA) tissues to 5-fluorouracil (5-FU) were evaluated at 200 μg/mL 5-FU using histoculture drug response assay (HDRA). The median value of % I.I. (36.5%) was selected as the cut-off for classifying these tissues as responders and non-responders. Each circle represents one CCA sample. The median is shown by the long, thin horizontal line.
Figure 4 Relationship between chemosensitivity to 5-fluorouracil and mRNA expression of thymidine phosphorylase, orotate phosphoribosyl transferase, thymidylate synthase, and dihydropyrimidine dehydrogenase in 23 cholangiocarcinoma tissues.
Chemosensitivity to 5-fluorouracil (5-FU) and mRNA expression were analyzed for 23 cholangiocarcinoma (CCA) tissues using histoculture drug response assay and quantitative real-time reverse transcription-polymerase chain reaction. The responders and non-responders were classified using the median value of the % I.I. as the cut-off point. The mRNA expression of orotate phosphoribosyl transferase (OPRT) was significantly higher in the responder (P < 0.05) group. The mRNA levels of thymidylate synthase (TS), and dihydropyrimidine dehydrogenase (DPD) and thymidine phosphorylase (TP) in the non-responder and responder groups, however, were not significantly different. The long, thin lines represent the mean, and the error bars represent the SD values. Each symbol (circles and squares) represents one CCA tissue sample.
- Citation: Hahnvajanawong C, Chaiyagool J, Seubwai W, Bhudhisawasdi V, Namwat N, Khuntikeo N, Sripa B, Pugkhem A, Tassaneeyakul W. Orotate phosphoribosyl transferase mRNA expression and the response of cholangiocarcinoma to 5-fluorouracil. World J Gastroenterol 2012; 18(30): 3955-3961
- URL: https://www.wjgnet.com/1007-9327/full/v18/i30/3955.htm
- DOI: https://dx.doi.org/10.3748/wjg.v18.i30.3955


