Copyright
©2012 Baishideng Publishing Group Co.
World J Gastroenterol. Jan 21, 2012; 18(3): 244-250
Published online Jan 21, 2012. doi: 10.3748/wjg.v18.i3.244
Published online Jan 21, 2012. doi: 10.3748/wjg.v18.i3.244
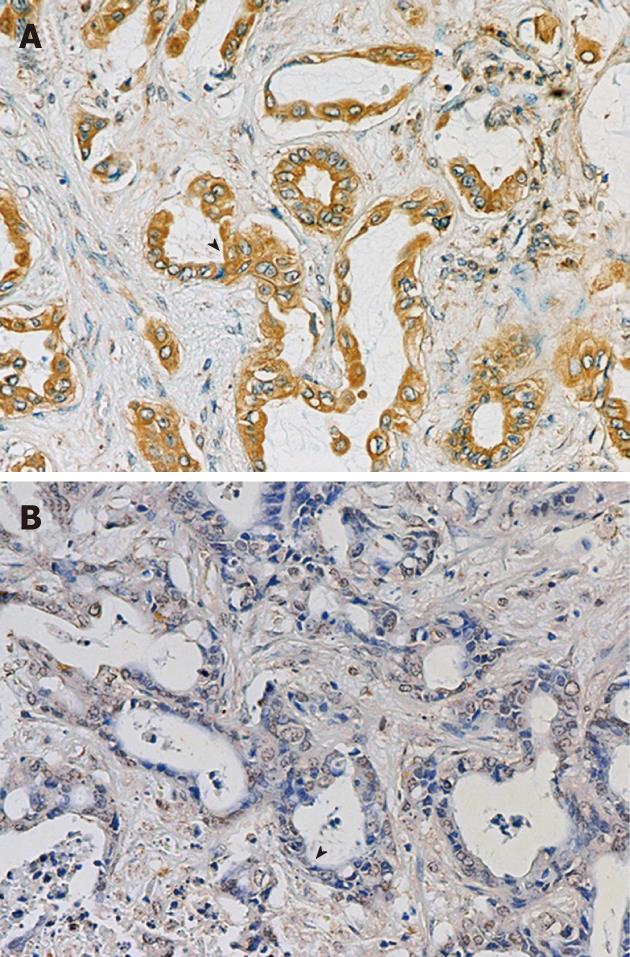
Figure 1 Immunohistochemical staining of urokinase plasminogen activator protein expression in cholangiocarcinoma tissues.
Tissue microarray slide was stained with anti-urokinase plasminogen activator (uPA) antibody and counter-stained with Mayer’s hematoxylin. Representative of +++ (A) and negative (B) uPA staining.
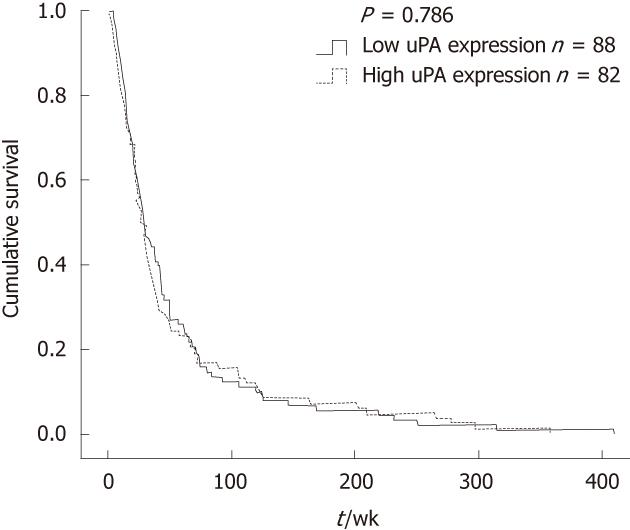
Figure 2 Correlation between urokinase plasminogen activator expression and patients’ survival by Kaplan-Meier plot.
Low urokinase plasminogen activator (uPA) expression was referred to as negative and +, whereas high uPA expression was ++ and +++.
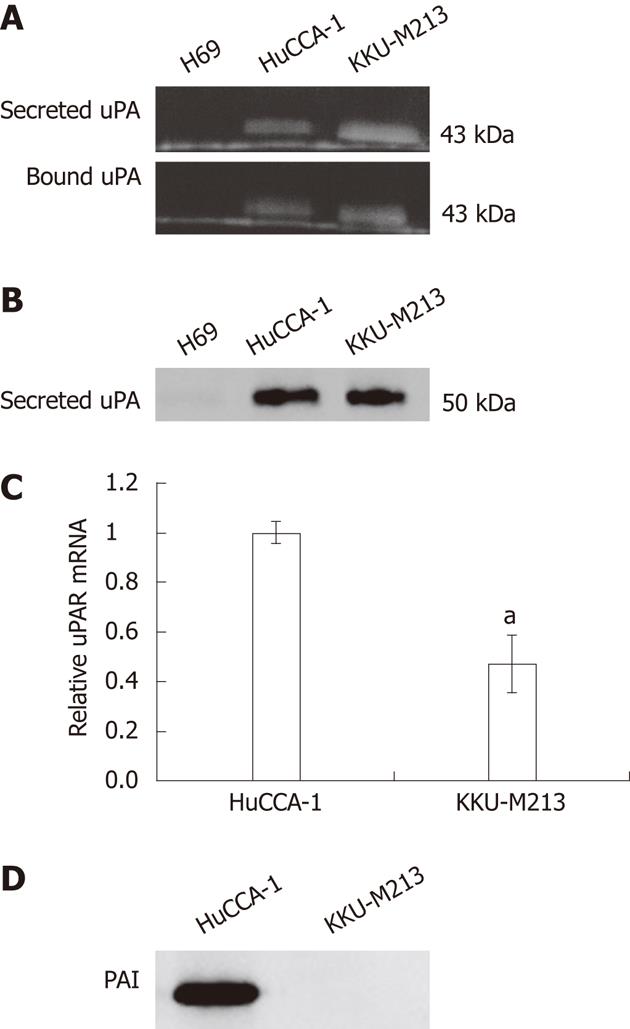
Figure 3 Levels of urokinase plasminogen activator, plasminogen activator inhibitor type 1 protein and urokinase plasminogen activator receptor expression in two cholangiocarcinoma cell lines and immortalized cholangiocytes.
A: Levels of secreted urokinase plasminogen activator (uPA) in 40× concentrated conditioned medium and cell-surface-bound uPA were determined by plasminogen-gelatin zymography; B and D: Levels of secreted uPA (B); and secreted plasminogen activator inhibitor type 1 (PAI-1) (D) proteins were determined by western blotting; C: Level of uPAR mRNA was examined by SYBR Green-based qPCR and the data were calculated as relative uPAR expression compared to that of HuCCA-1, 2–ΔΔCt, and expressed as mean ± SE from three independent experiments. Significant difference is indicated by aP < 0.05.
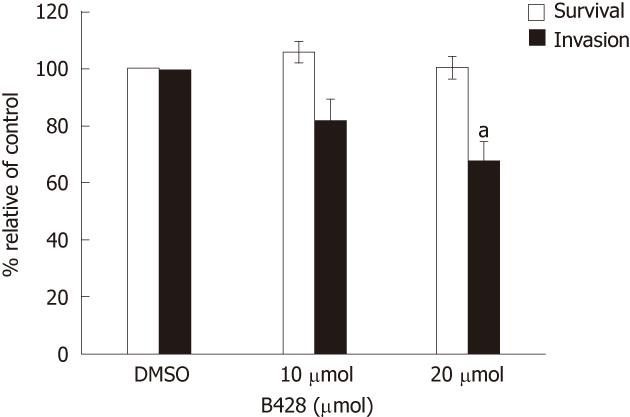
Figure 4 Effect of urokinase plasminogen activator inhibitor (B428) on KKU-M213 cell invasion.
Cell suspension in medium containing B428 (10 and 20 μmol/L) and 0.1% dimethyl sulfoxide (as a control) were subjected to in vitro invasion assay for 6 h. Cell survival was analyzed by 3-(4,5-dimethylthiazol-2-yl)-2,5-diphenyl tetrazolium bromide assay after cells were incubated with the drug for 6 h. The results were presented as mean ± SE from three independent experiments. Significant difference is indicated by aP < 0.05.
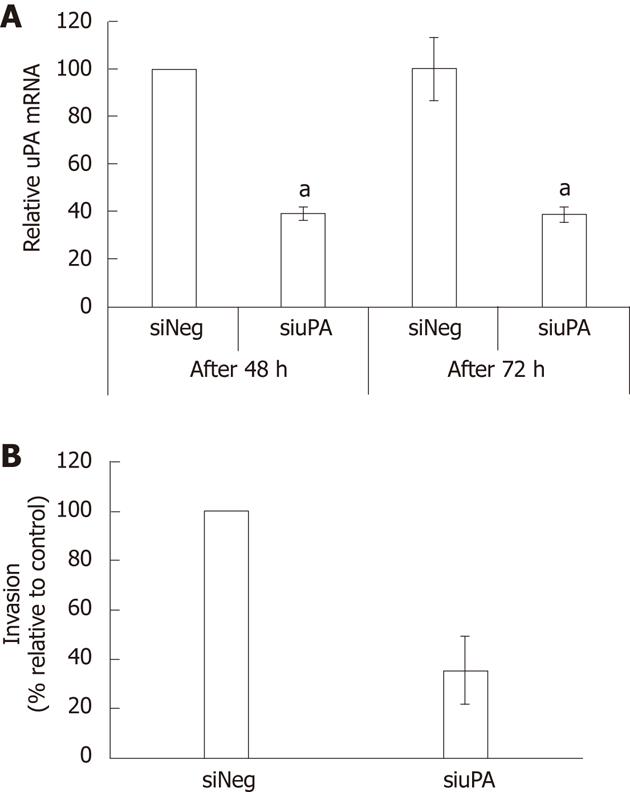
Figure 5 Effects of urokinase plasminogen activator knockdown on KKU-M213 cell invasion.
A: Level of urokinase plasminogen activator (uPA) mRNA of the cells transfected with siRNA against uPA or non-targeting siRNA for 48 and 72 h were determined by real-time reverse transcriptase polymerase chain reaction. Significant difference is indicated by aP < 0.05; B: Cells transfected with siRNA for 66 h were analyzed for cell invasiveness using Transwell in vitro invasion assay. The results were presented as mean ± SE from three independent experiments.
- Citation: Thummarati P, Wijitburaphat S, Prasopthum A, Menakongka A, Sripa B, Tohtong R, Suthiphongchai T. High level of urokinase plasminogen activator contributes to cholangiocarcinoma invasion and metastasis. World J Gastroenterol 2012; 18(3): 244-250
- URL: https://www.wjgnet.com/1007-9327/full/v18/i3/244.htm
- DOI: https://dx.doi.org/10.3748/wjg.v18.i3.244


