Copyright
©2012 Baishideng Publishing Group Co.
World J Gastroenterol. Jul 21, 2012; 18(27): 3565-3570
Published online Jul 21, 2012. doi: 10.3748/wjg.v18.i27.3565
Published online Jul 21, 2012. doi: 10.3748/wjg.v18.i27.3565
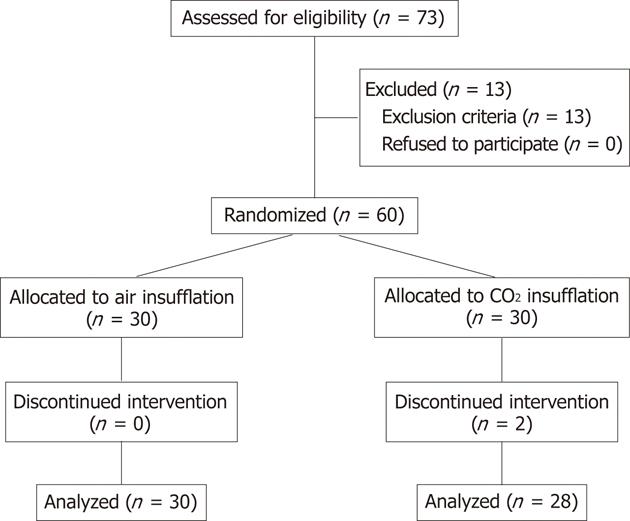
Figure 1 Flow diagram showing selection of study subjects.
CO2: Carbon dioxide.
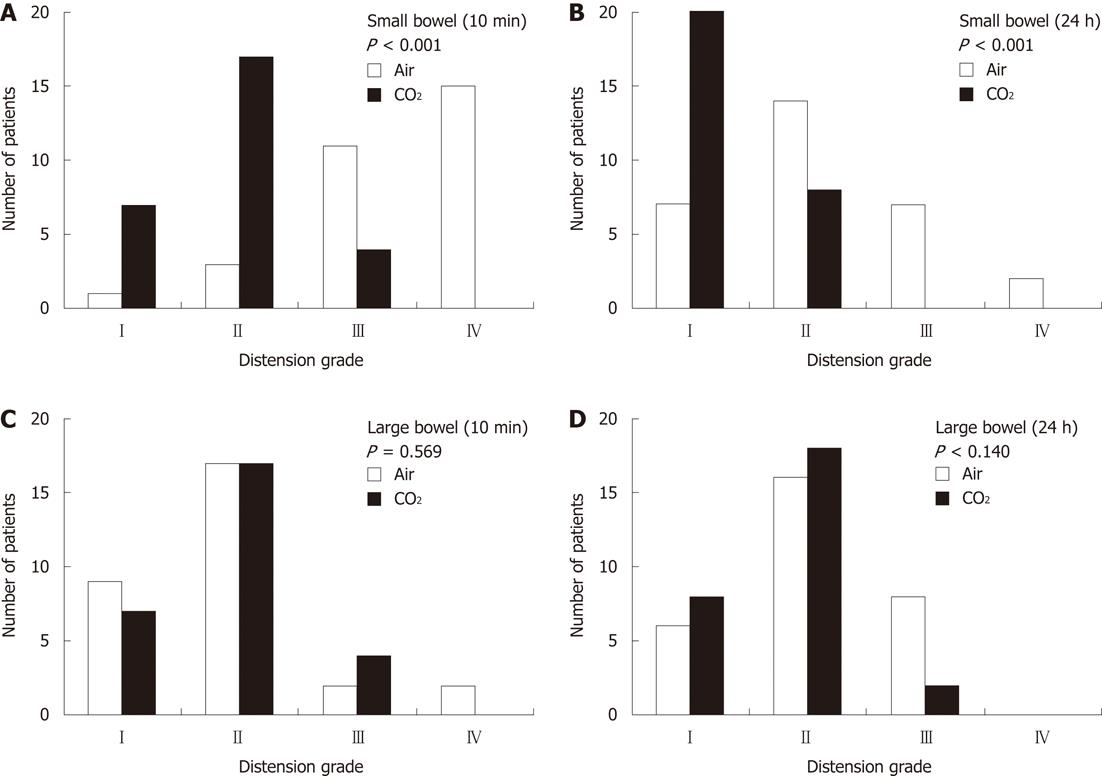
Figure 2 Radiographic evaluation of abdominal distension after percutaneous endoscopic gastrostomy.
The degree of small bowel distension [A: 10 min after percutaneous endoscopic gastrostomy (PEG), B: 24 h after PEG] and large bowel distension (C: 10 min after PEG, D: 24 h after PEG) was evaluated by radiography as follows: grade I: No distension; grade II: Slight distension; grade III: Moderate distension; grade IV: Severe distension; CO2: Carbon dioxide.
- Citation: Nishiwaki S, Araki H, Hayashi M, Takada J, Iwashita M, Tagami A, Hatakeyama H, Hayashi T, Maeda T, Saito K. Inhibitory effects of carbon dioxide insufflation on pneumoperitoneum and bowel distension after percutaneous endoscopic gastrostomy. World J Gastroenterol 2012; 18(27): 3565-3570
- URL: https://www.wjgnet.com/1007-9327/full/v18/i27/3565.htm
- DOI: https://dx.doi.org/10.3748/wjg.v18.i27.3565


