Copyright
©2012 Baishideng Publishing Group Co.
World J Gastroenterol. Jul 14, 2012; 18(26): 3389-3399
Published online Jul 14, 2012. doi: 10.3748/wjg.v18.i26.3389
Published online Jul 14, 2012. doi: 10.3748/wjg.v18.i26.3389
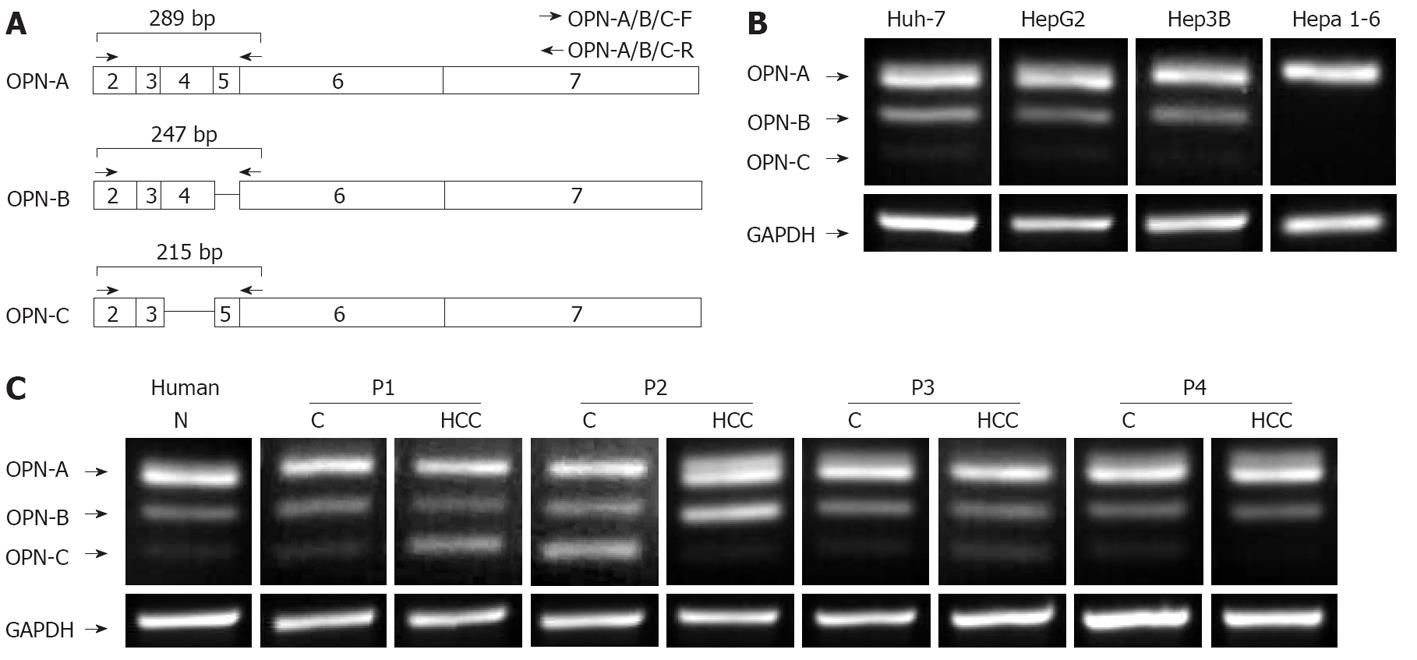
Figure 1 Osteopontin splice variants are expressed at different levels in the liver of hepatocellular carcinoma patients and in various cell lines.
A: Schematic representation of the three osteopontin (OPN) splice variants; B: Polymerase chain reaction (PCR) performed on cDNA from different cell types shows varying distribution patterns of OPN mRNA; C: PCR performed on cDNA taken from patient hepatocellular carcinoma (HCC), and its surrounding tissue indicates altered OPN splice variant expression in HCC. GAPDH: Glyceraldehyde-3-phosphate dehydrogenase.
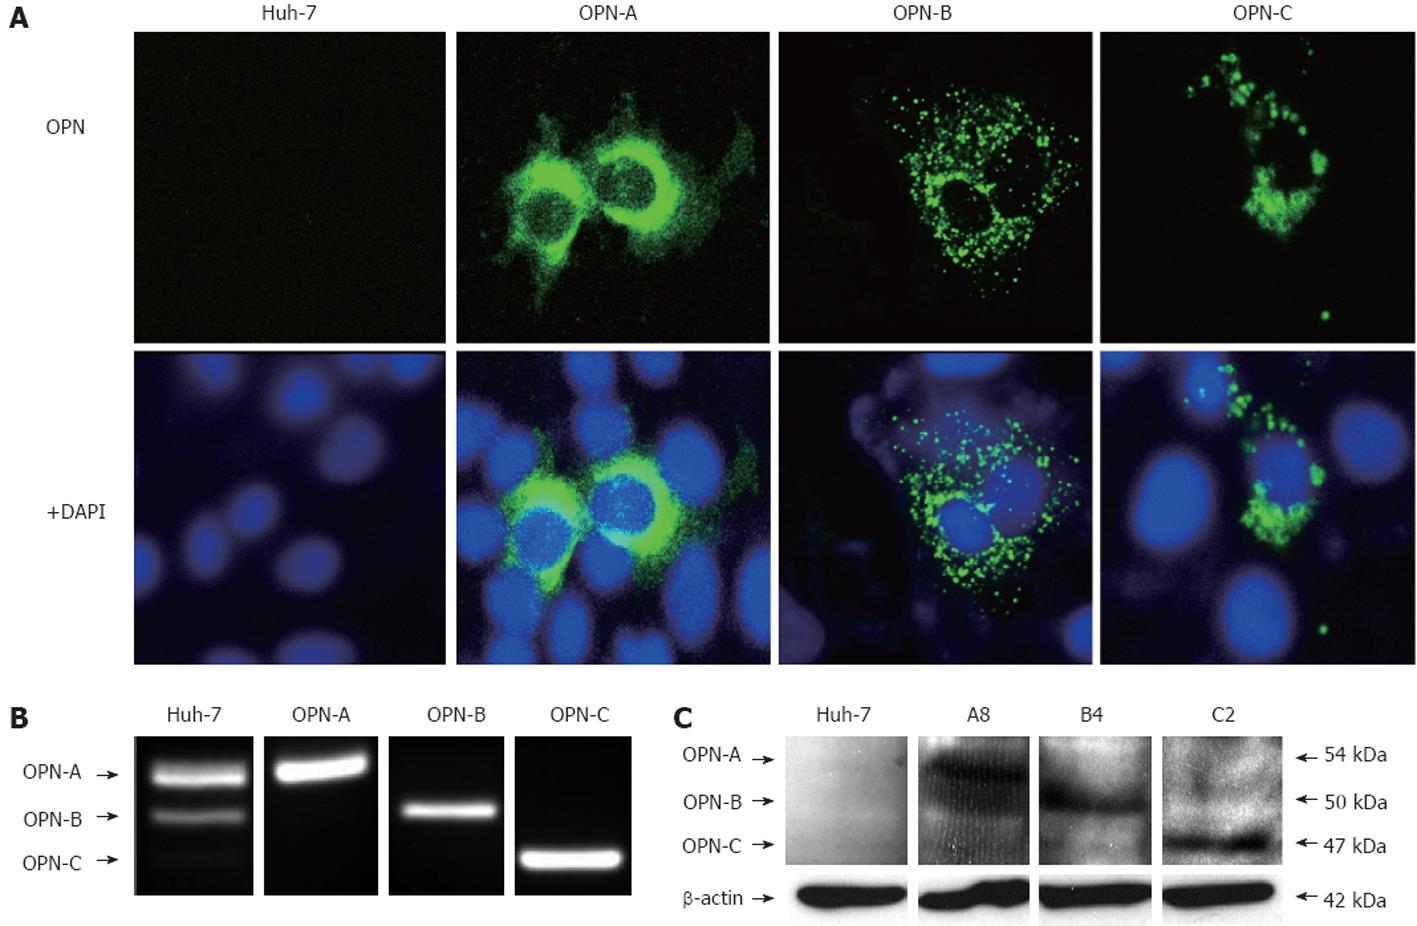
Figure 2 Stable expression of osteopontin splice variants demonstrates unique localisation patterns.
Huh-7 cell stably overexpressing osteopontin (OPN)-A, -B, -C, or the control, were stained for OPN expression and visualised fluorescently to demonstrate localisation of the three splice variants (A); Stable expression was confirmed using polymerase chain reaction (B), and Western blotting (C). DAPI: 4’,6-diamidino-2-phenylindole.
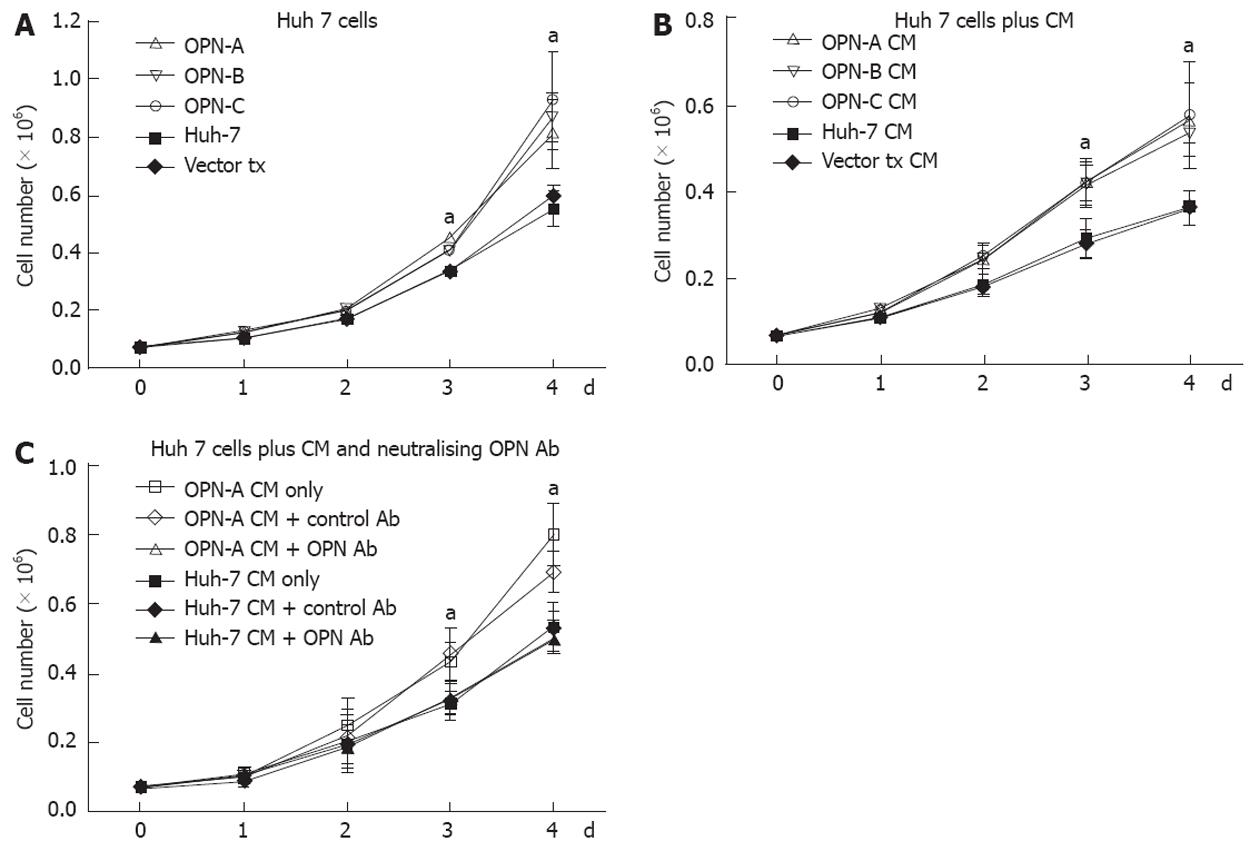
Figure 3 Osteopontin splice variants increase Huh-7 cell growth.
A: Osteopontin (OPN)-A, -B, -C and control-expressing Huh-7 stable cell lines in conjunction with Huh-7 cells, were seeded at a density of 7 × 10⁴ cells per well in a 12-well plate and cell numbers monitored daily using trypan blue exclusion; B: Conditioned media (CM) was removed from OPN-A, -B, -C and control-expressing Huh-7 stable cell lines in conjunction with Huh-7 cells and placed onto Huh-7 cells. Cells were monitored as mentioned above; C: Huh-7 cells were seeded at a density of 7 × 10⁴ cells per well in a 12-well plate and conditioned media from OPN-A, -B, -C and control expressing-Huh-7 stable cell lines placed onto the cells in conjunction with either anti-OPN (OPN Ab) or an control immunoglobulin. aP < 0.05.
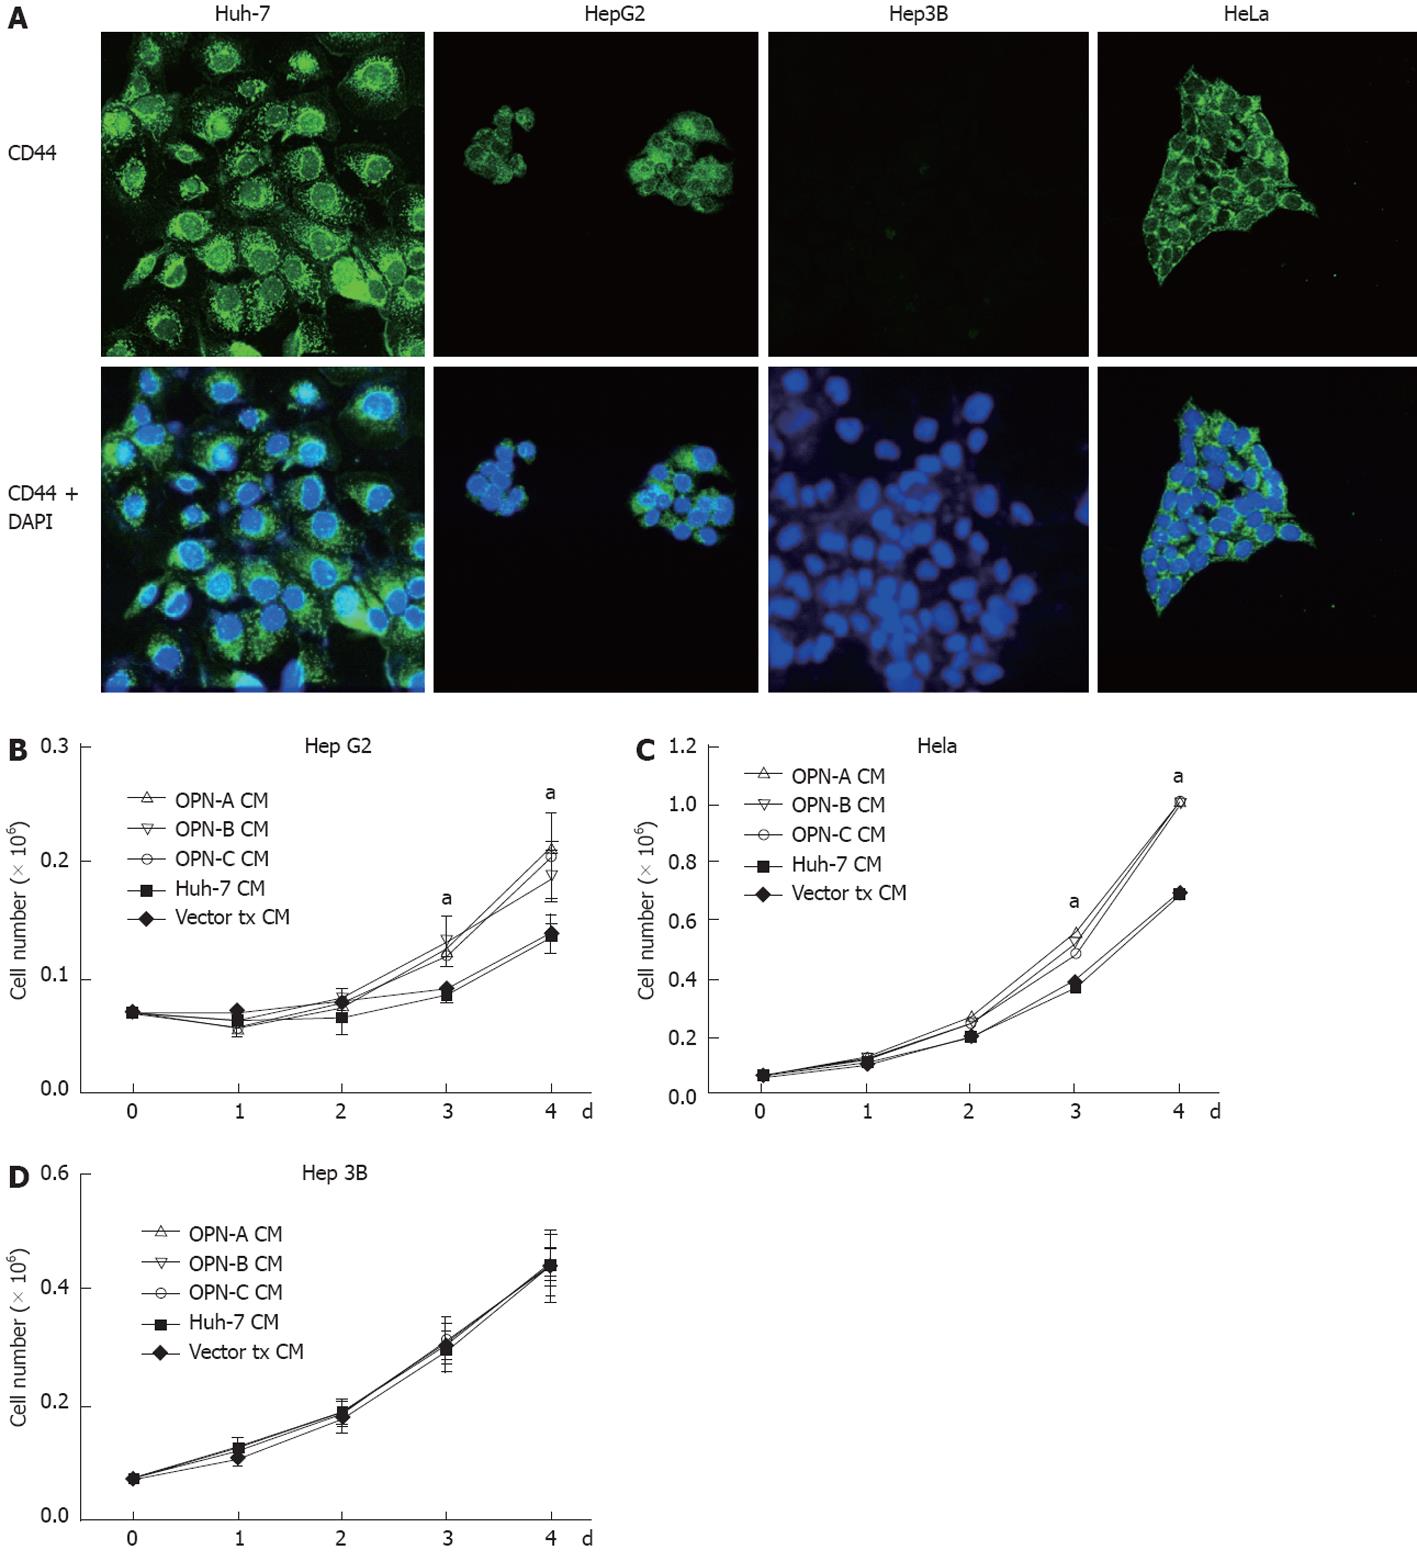
Figure 4 CD44 expression is necessary for increased cellular growth due to osteopontin expression.
Huh-7, HepG2, Hep3B and HeLa cells were immunostained for 4’,6-diamidino-2-phenylindole (DAPI) and CD44 expression (A); Conditioned media (CM) was removed from osteopontin (OPN)-A, -B, -C and control-expressing Huh-7 stable cell lines in conjunction with Huh-7 cells and placed onto Hep G2 cells (B); HeLa cells (C) or Hep 3B cells (D); cell numbers were monitored daily using a trypan blue exclusion. aP < 0.05.
Figure 5 CD44 engagement is necessary for osteopontin-a induced cell growth in Huh-7 and HeLa cells.
(A) Huh-7 or (B) HeLa cells were seeded at a density of 7 × 10⁴ cells per well in a 12-well plate and conditioned media from osteopontin (OPN)-A Huh-7 stable cell lines or Huh-7 cells alone placed onto the cells in conjunction with either anti-CD44 or a control immunoglobulin. Cell numbers were monitored daily using trypan blue exclusion. CM: Conditioned media. aP < 0.05.
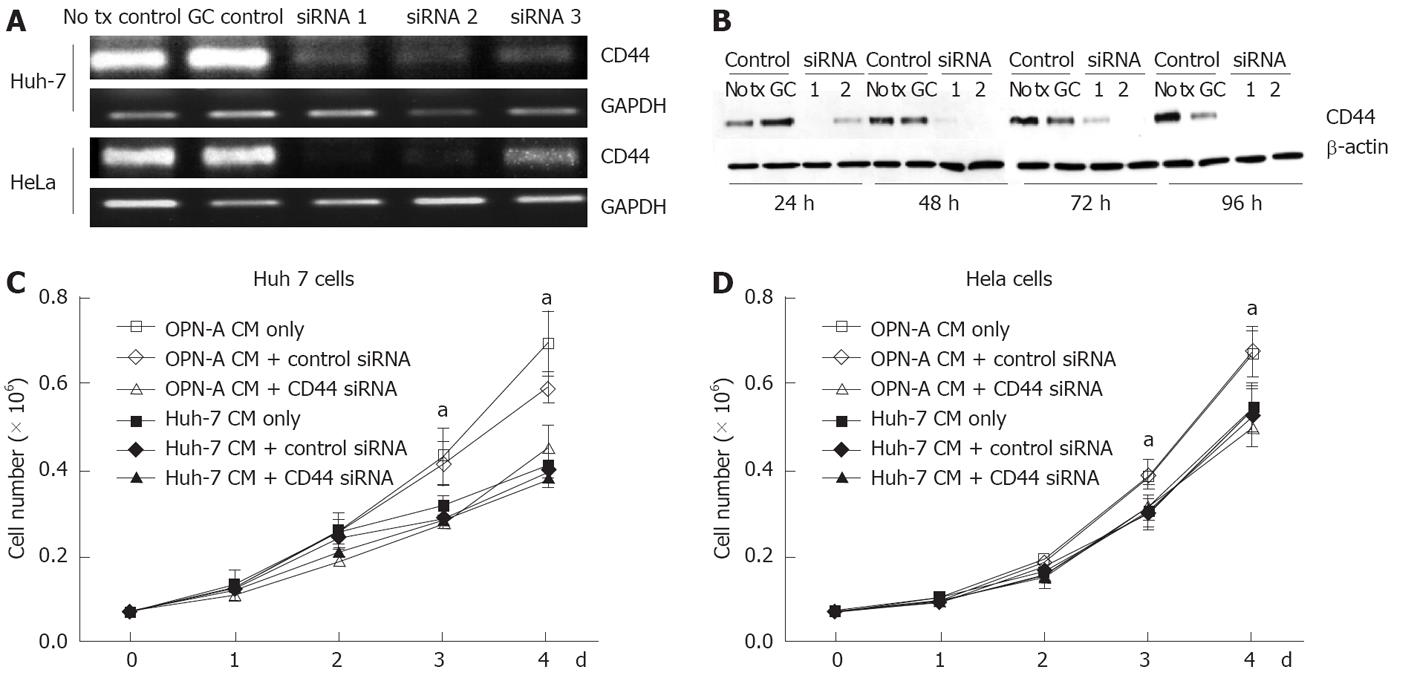
Figure 6 CD44 knockdown inhibits osteopontin-a-induced cell growth in Huh-7 and HeLa cells.
A panel of 3 Stealth siRNA’s were investigated for their ability to limit CD44 mRNA expression using polymerase chain reaction (A), further validation was achieved by examining protein reduction of CD44 using Western blotting (B). (C) Huh-7 or (D) HeLa cells were seeded at a density of 7 × 10⁴ cells per well in a 12-well plate and a CD44 siRNA pool containing Stealth siRNA1 and 2 was transfected into the cultures 24 h prior to placing conditioned media from osteopontin (OPN)-A Huh-7 stable cell lines or Huh-7 cells alone onto the cells. Cell numbers were monitored daily using trypan blue exclusion. CM: Conditioned media; GAPDH: Glyceraldehyde-3-phosphate dehydrogenase. aP < 0.05.
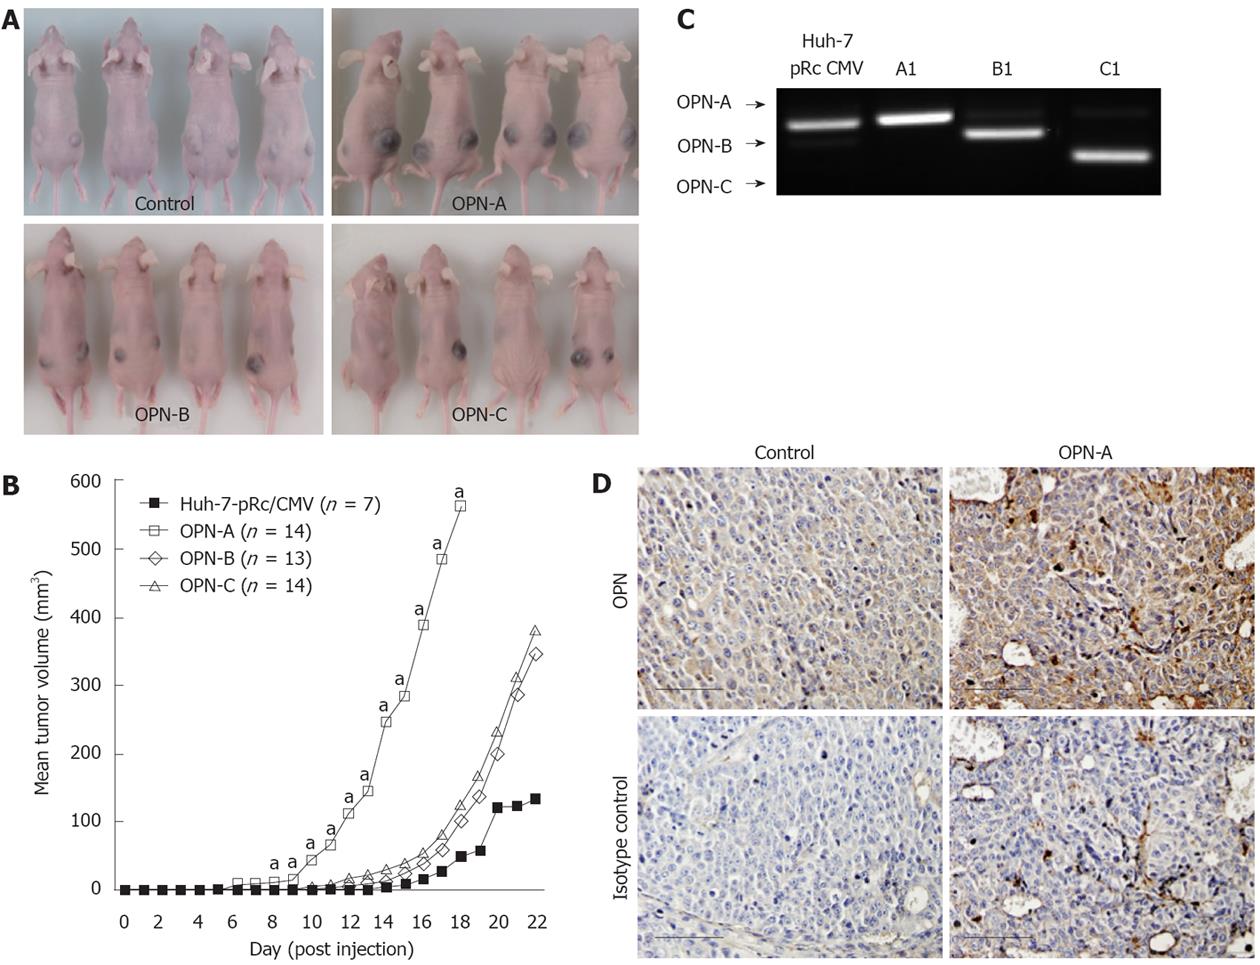
Figure 7 Over expression of the three osteopontin splice variants promotes Huh-7 tumour growth in Balb/c nude mice.
A: Growth of tumours in mice injected in the hind flanks with osteopontin (OPN)-A, -B, -C or control-expressing stable cell lines, with mean tumour volumes at the time of euthanasia expressed graphically in (B) aP < 0.05 OPN-A/Huh-7 vector only; C: Polymerase chain reaction analysis of a representative tumour from each of the 4 groups showing OPN mRNA expression in all tumours; D: OPN-a expressing tumours display increased levels of OPN protein. Control and OPN-A tumour sections were immunostained for OPN in conjunction with a rabbit isotype control. Bar represents 100 μm.
- Citation: Phillips RJ, Helbig KJ, Hoek KHVD, Seth D, Beard MR. Osteopontin increases hepatocellular carcinoma cell growth in a CD44 dependant manner. World J Gastroenterol 2012; 18(26): 3389-3399
- URL: https://www.wjgnet.com/1007-9327/full/v18/i26/3389.htm
- DOI: https://dx.doi.org/10.3748/wjg.v18.i26.3389


