Copyright
©2012 Baishideng Publishing Group Co.
World J Gastroenterol. Jul 7, 2012; 18(25): 3282-3287
Published online Jul 7, 2012. doi: 10.3748/wjg.v18.i25.3282
Published online Jul 7, 2012. doi: 10.3748/wjg.v18.i25.3282
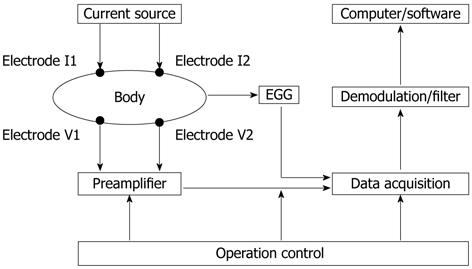
Figure 1 Diagram of gastric motility measurement.
EGG: Electrogastrogram.
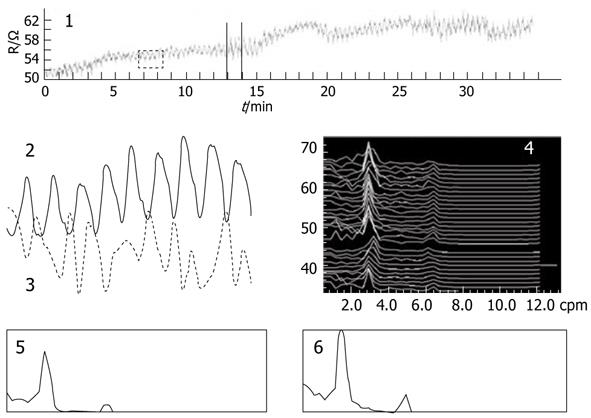
Figure 2 Results of impedance gastric motility measurement and spectra analysis for a healthy volunteer.
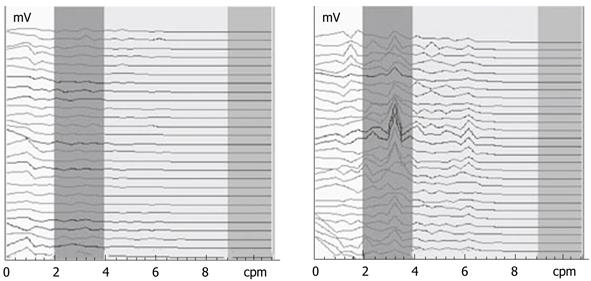
Figure 3 Electrogastrogram dynamic spectra of functional dyspepsia patients before treatment (left) and one wk after treatment (right).
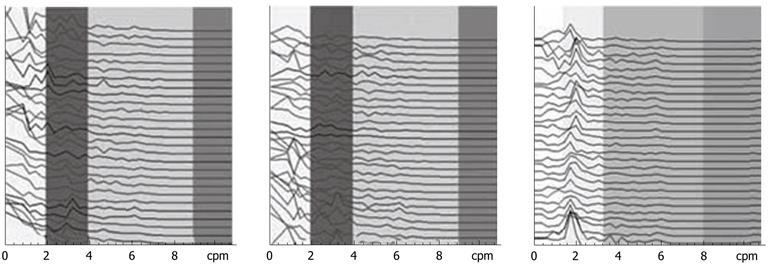
Figure 4 Impedance gastric motility dynamic spectra of functional dyspepsia patients before treatment (left) and 1 wk (middle) and 3 wk (right) after treatment.
- Citation: Zhao S, Sha H, Li ZY, Ren CS. Electrical bioimpedance gastric motility measurement based on an electrical-mechanical composite mechanism. World J Gastroenterol 2012; 18(25): 3282-3287
- URL: https://www.wjgnet.com/1007-9327/full/v18/i25/3282.htm
- DOI: https://dx.doi.org/10.3748/wjg.v18.i25.3282


