Copyright
©2012 Baishideng Publishing Group Co.
World J Gastroenterol. Jul 7, 2012; 18(25): 3272-3281
Published online Jul 7, 2012. doi: 10.3748/wjg.v18.i25.3272
Published online Jul 7, 2012. doi: 10.3748/wjg.v18.i25.3272
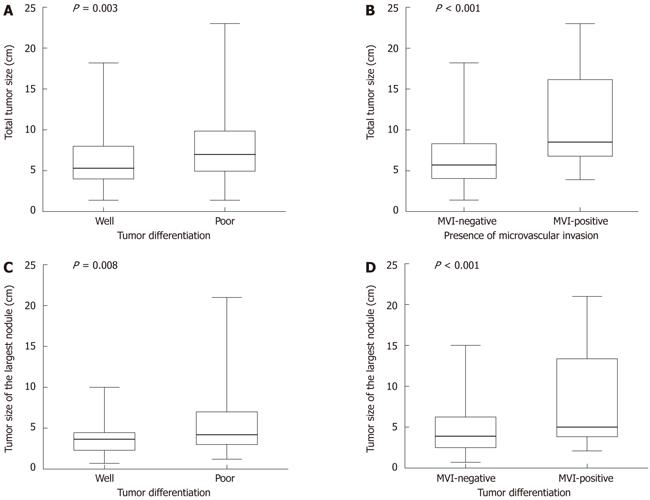
Figure 1 Distribution of tumor size according to tumor differentiation and presence of microvascular invasion, showing median, 25th-75th percentile box and complete range of measurements.
A: Distribution of total tumor size according to tumor differentiation (P = 0.003); B: Distribution of total tumor size according to presence of microvascular invasion (P < 0.001); C: Distribution of the largest tumor size according to tumor differentiation (P = 0.008); D: Distribution of total tumor size according to tumor differentiation and presence of microvascular invasion (P < 0.001). The tumor size was associated with presence of microvascular invasion and poor tumor differentiation. MVI: Microvascular invasion.
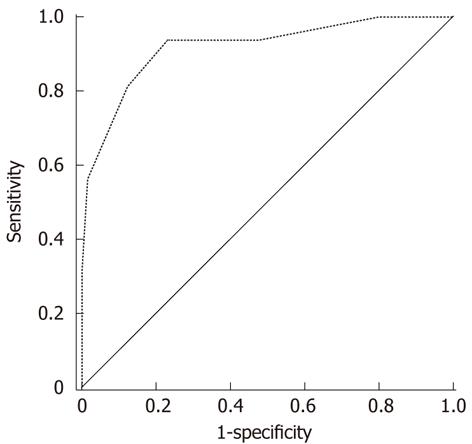
Figure 2 Receiver operating characteristics curve of the predictive scoring system.
The area under the curve was 0.925, 95% confidence interval was 0.864-0.985 (P < 0.001). The data indicated that the scoring system had a strong ability to predict the 1-year outcome of patients with multiple hepatocellular carcinoma after hepatic resection.
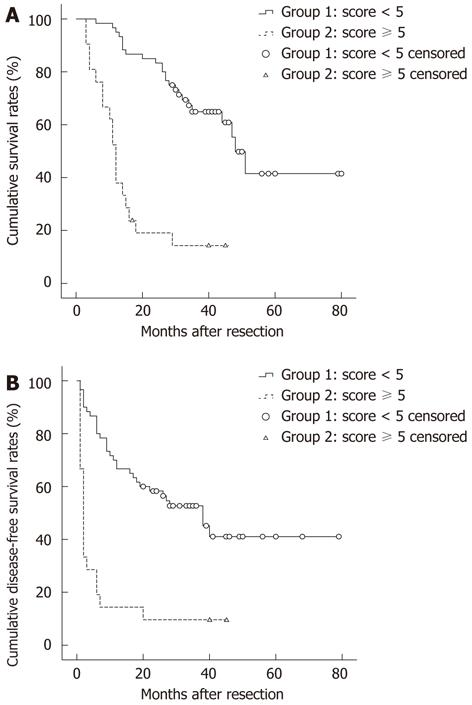
Figure 3 Results of long-term survival of group 1 (score < 5) and group 2 (score ≥ 5).
The overall survival and disease-free survival in group 2 were significant poorer than those in group 1 (both P < 0.001).
- Citation: Zhao WC, Zhang HB, Yang N, Fu Y, Qian W, Chen BD, Fan LF, Yang GS. Preoperative predictors of short-term survival after hepatectomy for multinodular hepatocellular carcinoma. World J Gastroenterol 2012; 18(25): 3272-3281
- URL: https://www.wjgnet.com/1007-9327/full/v18/i25/3272.htm
- DOI: https://dx.doi.org/10.3748/wjg.v18.i25.3272


