Copyright
©2012 Baishideng Publishing Group Co.
World J Gastroenterol. Jul 7, 2012; 18(25): 3235-3249
Published online Jul 7, 2012. doi: 10.3748/wjg.v18.i25.3235
Published online Jul 7, 2012. doi: 10.3748/wjg.v18.i25.3235
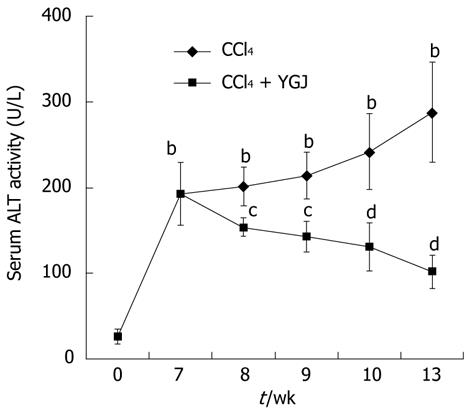
Figure 1 Serum alanine aminotransferase activity in mice.
ALT activities in CCl4 groups increased continuously but declined in YGJ + CCl4 groups over the entire period. bP < 0.01 vs the week 0 control group; cP < 0.05, dP < 0.01 vs the same time-point CCl4 group. Results are presented as mean ± SD. ALT: Alanine aminotransferase; CCl4: Carbone tetrachloride; YGJ: Yiguanjian.
Figure 2 Collagen staining with Sirius red and Hyp content.
A: Collagen staining. Week 0 control mice have limited collagen in the portal area, but fibrous septa bridging the portal tracts were found in the livers of CCl4-treated mice, and this was significantly attenuated in YGJ-treated mice, × 200; B: Semi-quantification of collagen staining, the week 0 control group level was set as the basal level; C: Hyp content in the liver. Results of collagen staining and Hyp content show that they both continuously increased in the CCl4-treated group but declined in the YGJ + CCl4 group over the entire period. aP < 0.05, bP < 0.01 vs week 0 control group; cP < 0.05, dP < 0.01 vs the same time-point CCl4 group. Results are presented as mean ± SD. CCl4: Carbone tetrachloride; YGJ: Yiguanjian; Hyp: Hydroxyproline.
Figure 3 Immunostaining and Western blot analysis of α-smooth muscle actin in liver tissues.
A: α-smooth muscle actin (α-SMA) immunostaining, × 200; B: Semi-quantification of α-SMA positive area, with the level in the week 0 control group set as the basal level; C: Western blotting of α-SMA; D: Semi-quantification of the α-SMA Western blot results, with the week 0 control group level set as the basal level. bP < 0.01 vs week 0 control group; dP < 0.01 vs the same time-point CCl4 group. Results are mean ± SD. CCl4: Carbone tetrachloride; YGJ: Yiguanjian; GAPDH: Glyceraldehydes-3-phosphate dehydrogenase.
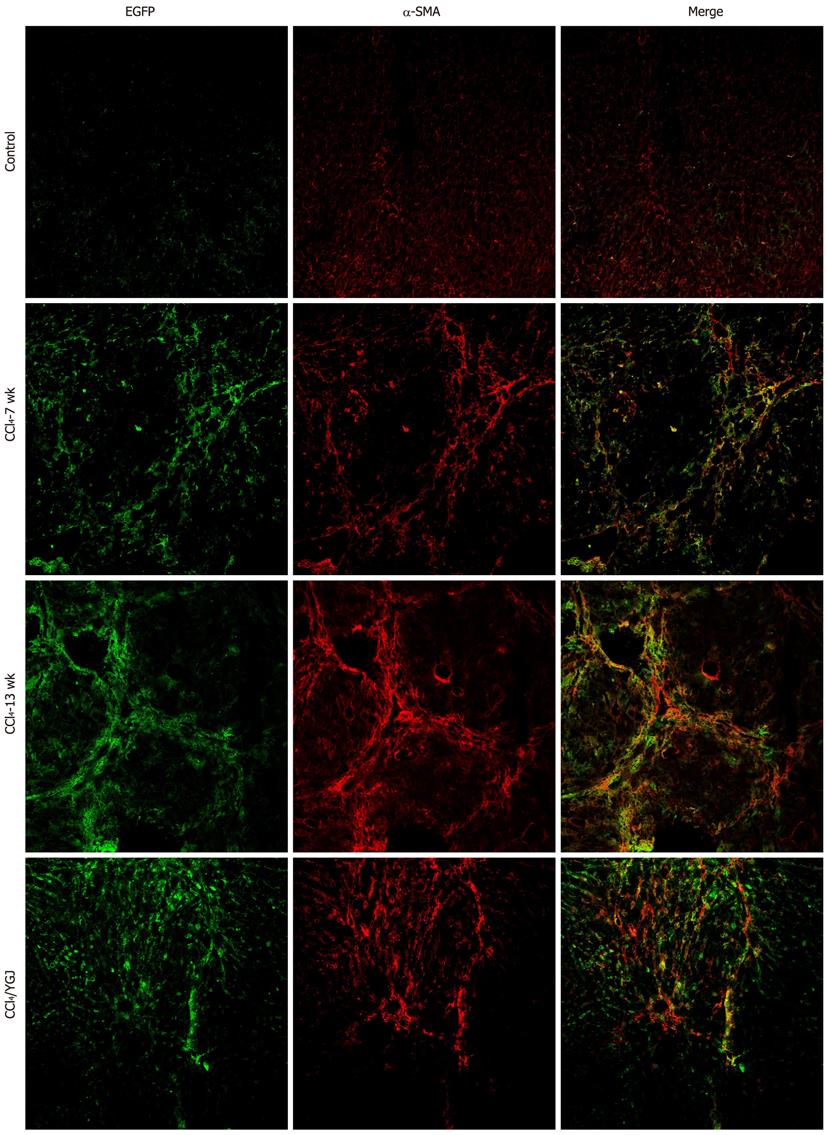
Figure 4 Immunofluorescent colocalization of enhanced green fluorescent protein and α-smooth muscle actin in CCl4-induced chronic liver injury in bone marrow chimera mice, × 200.
EGFP is shown in green and α-smooth muscle actin (α-SMA) in red. A yellow color confirms colocalization in the merged images. The number of EGFP/α-SMA double positive cells was found to increase in all mice after receiving CCl4 injection and they were mainly found in the areas of scarring. In contrast, the number of EGFP+/α-SMA+ cells decreased in the YGJ treatment group. EGFP: Enhanced green fluorescent protein; YGJ: Yiguanjian.
Figure 5 Immunofluorescent colocalization of enhanced green fluorescent protein and albumin in CCl4-induced chronic liver injured bone marrow chimera mice, × 200.
EGFP is shown in green and Alb in red. No yellow color is visible in the merged images in control, CCl4 or CCl4 + YGJ groups. EGFP: Enhanced green fluorescent protein; YGJ: Yiguanjian; Alb: Albumin.
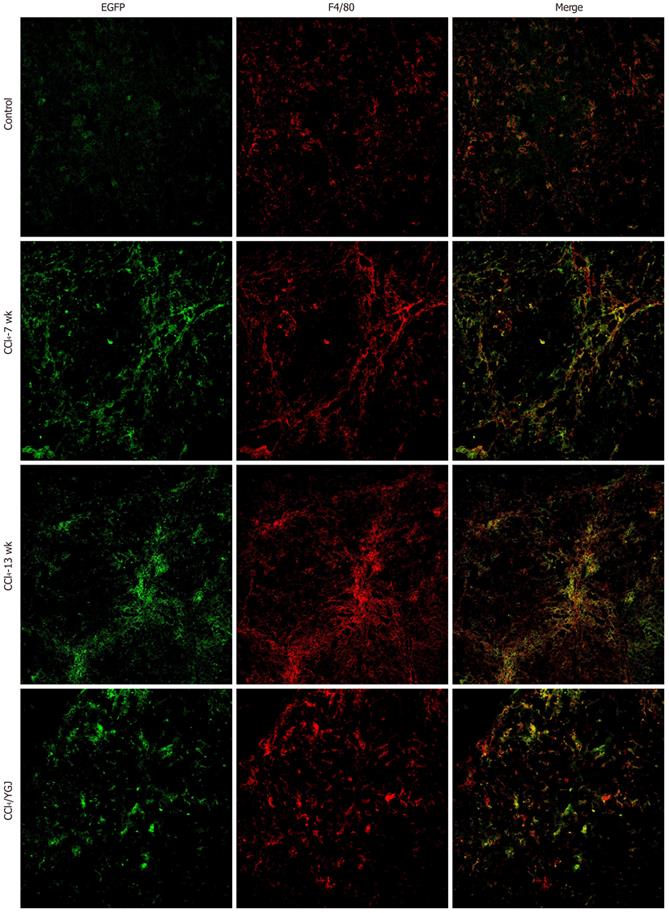
Figure 6 Immunofluorescent colocalization of enhanced green fluorescent protein and F4/80 in CCl4-induced chronic liver injured bone marrow chimera mice, × 200.
EGFP is shown in green and F4/80 in red. A yellow color confirms colocalization in the merged images. The number of EGFP/F4/80 double positive cells was found to increase in all mice after receiving CCl4 injection. In contrast, the number of EGFP+/F4/80+ cells decreased in the YGJ treatment group. EGFP: Enhanced green fluorescent protein; YGJ: Yiguanjian.
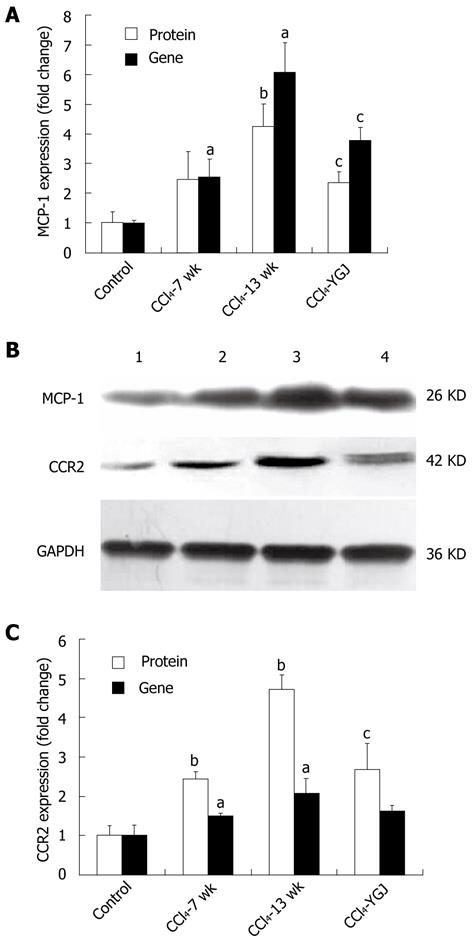
Figure 7 Gene expression analyzed by real-time polymerase chain reaction and protein expression analyzed by Western blotting of monocyte chemotaxis protein-1 and CC chemokine receptor 2 in CCl4-induced chronic liver injured bone marrow chimera mice.
A: MCP-1 gene and protein expression. For both genes the relative expression is quantified using the control group as the basal level; B: MCP-1 and CCR2 bands by Western blotting. Band 1, control group; band 2, CCl4 7 wk group; band 3, CCl4 13 wk group; and band 4, CCl4 + Yiguanjian (YGJ) group; C: CCR2 gene and protein expression. For both genes the relative expression is quantified using the control group as the basal level. MCP-1: Monocyte chemotaxis protein-1; CCR2: CC chemokine receptor 2; GAPDH: Glyceraldehydes-3- phosphate dehydrogenase. aP < 0.05, bP < 0.01 vs week 0 control group; cP < 0.05 vs the same time-point CCl4 group.
Figure 8 Hepatocyte function.
A: Ki-67 immunostaining in liver tissues, × 200; B: Semi-quantification of Ki-67 staining, with the week 0 control group level as the basal level; C: Serum Alb content; D: Liver Alb Western blotting bands; E: Semi-quantification of Alb based on Western blotting results, with the week 0 control group level as the basal level. aP < 0.05, bP < 0.01 vs week 0 control group; cP < 0.05, dP < 0.01 vs the same time-point CCl4 group. Results are presented as mean ± SD. GAPDH: Glyceraldehydes-3-phosphate dehydrogenase; YGJ: Yiguanjian; Alb: Albumin.
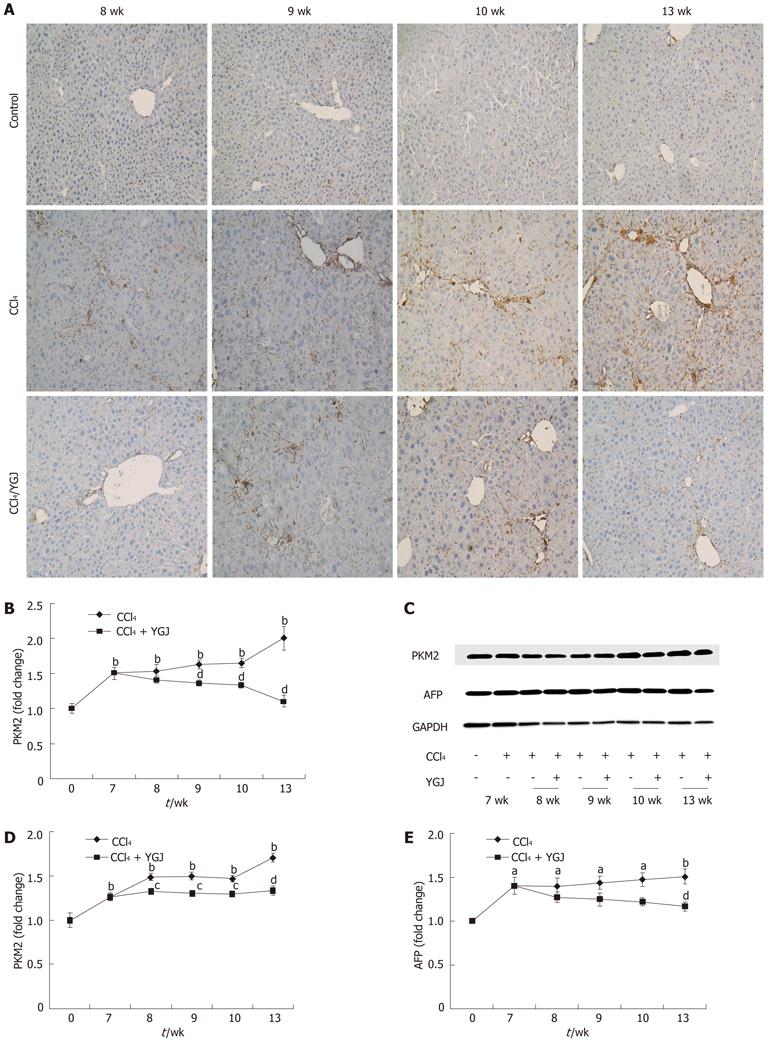
Figure 9 Expression of progenitor markers in liver tissues.
A: PKM2 immunostaining, × 200; B: Semi-quantification of PKM2 staining, with the week 0 control group level as the basal level; C: PKM2 and AFP Western blotting bands; D: Semi-quantification of PKM2 in Western blotting results, with the week 0 control group level as the basal level; E: Semi-quantification of Western blotting results of PKM2, with the week 0 control group level as the basal level. aP < 0.05, bP < 0.01 vs week 0 control group; cP < 0.05, dP < 0.01 vs the same time-point CCl4 group. Results are presented as mean ± SD. GAPDH: Glyceraldehydes-3-phosphate dehydrogenase; YGJ: Yiguanjian; PKM2: Mitogen-activated protein kinase-2; AFP: α fetoprotein.
- Citation: Wang XL, Jia DW, Liu HY, Yan XF, Ye TJ, Hu XD, Li BQ, Chen YL, Liu P. Effect of Yiguanjian decoction on cell differentiation and proliferation in CCl4-treated mice. World J Gastroenterol 2012; 18(25): 3235-3249
- URL: https://www.wjgnet.com/1007-9327/full/v18/i25/3235.htm
- DOI: https://dx.doi.org/10.3748/wjg.v18.i25.3235


