Copyright
©2012 Baishideng Publishing Group Co.
World J Gastroenterol. Jun 14, 2012; 18(22): 2798-2804
Published online Jun 14, 2012. doi: 10.3748/wjg.v18.i22.2798
Published online Jun 14, 2012. doi: 10.3748/wjg.v18.i22.2798
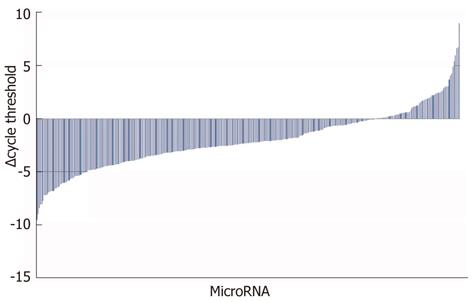
Figure 1 Plasma microRNA both up- and downregulated in lethally (500 mg/kg) compared to sublethally (150 mg/kg) dosed acetaminophen mice at the 12 h time point.
A total of 528 microRNAs were screened using the reverse transcriptase2 miRNA polymerase chain reaction (PCR) array of mouse whole genome, per the manufacturer’s protocol (SABioscience, Qiagen Sciences, MD). Quantitative PCR data were analyzed using manufacturer software (http://pcrdataanalysis.sabiosciences.com/pcr/arrayanalysis.php).
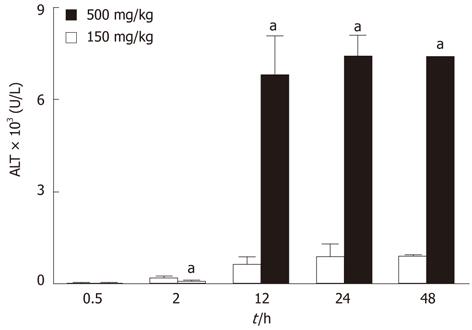
Figure 2 Increased hepatotoxicity (measured in elevated alanine aminotransferase levels) in lethally dosed acetaminophen mice over time.
aP < 0.05 vs 0.5 h time point for the 150 mg/kg and 500 mg/kg treatment groups, respectively. ALT: Alanine aminotransaminase.
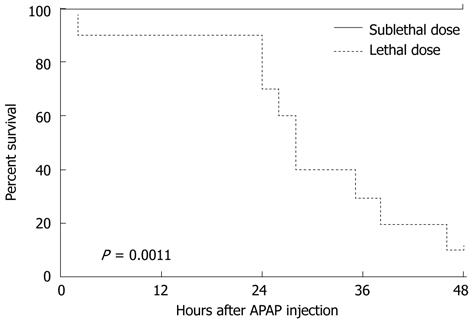
Figure 3 Survival of lethally compared to sublethally dosed acetaminophen mice.
Kaplan-Meier survival curve over time (h) after sublethal (150 mg/kg) and lethal (500 mg/kg) acetaminophen poisoning (P = 0.011).
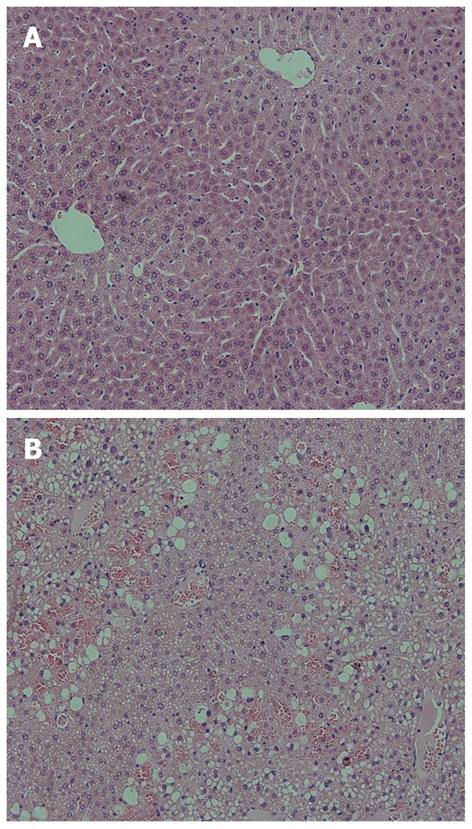
Figure 4 Histopathologic analysis of liver after lethal compared to sublethal acetaminophen dosing.
Hematoxylin and eosin liver tissue staining at 12 h of (A) sublethally (150 mg/kg) acetaminophen poisoned mice, with no signs of centrilobular inflammation or necrosis; and (B) lethally (500 mg/kg) acetaminophen poisoned mice with extensive centrilobular necrosis, enlarged hepatocytes, and highly vacuolated cytoplasm.
- Citation: Ward J, Bala S, Petrasek J, Szabo G. Plasma microRNA profiles distinguish lethal injury in acetaminophen toxicity: A research study. World J Gastroenterol 2012; 18(22): 2798-2804
- URL: https://www.wjgnet.com/1007-9327/full/v18/i22/2798.htm
- DOI: https://dx.doi.org/10.3748/wjg.v18.i22.2798


