Copyright
©2012 Baishideng Publishing Group Co.
World J Gastroenterol. Jun 14, 2012; 18(22): 2784-2792
Published online Jun 14, 2012. doi: 10.3748/wjg.v18.i22.2784
Published online Jun 14, 2012. doi: 10.3748/wjg.v18.i22.2784
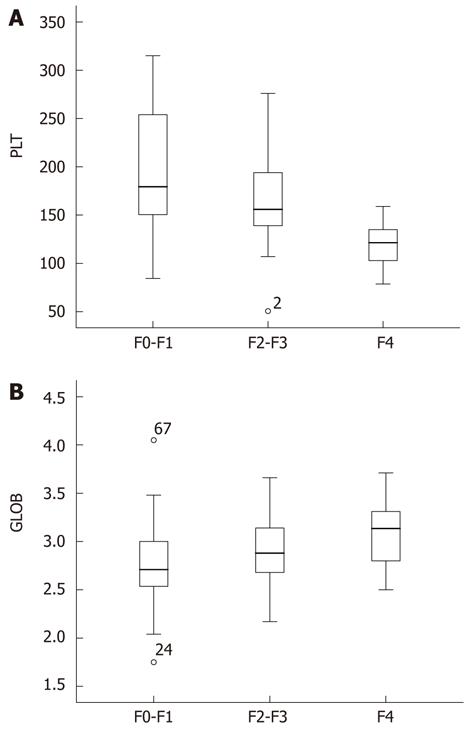
Figure 1 Scores of platelet count (A) and globulin (B) in three fibrosis stages (F0-F1, F2-F3 and F4).
The top and bottom of each box are the 25% and the 75% centiles. The line through the box is the median, and the error bars are the 5th and 95th centiles. GLOB: Globulin; PLT: Platelet count.
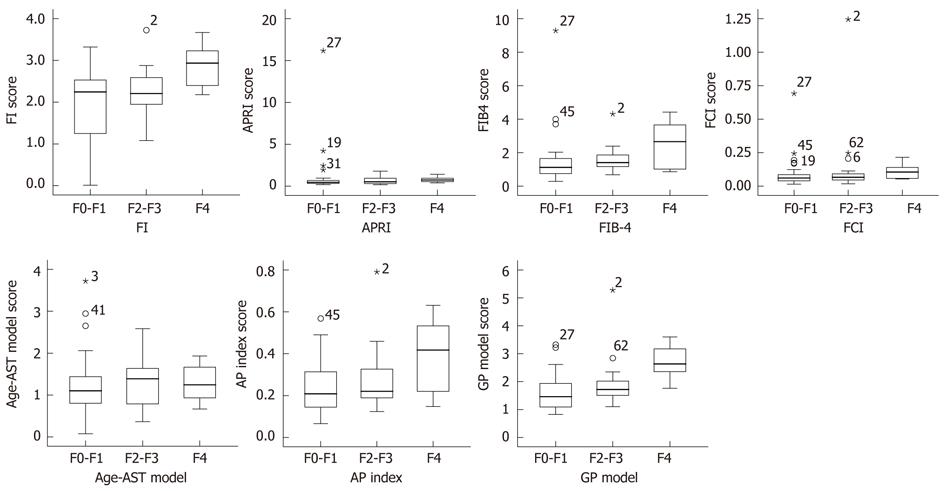
Figure 2 Box plot of fibrosis index, aspartate aminotransferase-platelet ratio, FIB-4, fibrosis-cirrhosis index, age-aspartate aminotransferase model, age-platelet count ratio and globulin/platelet model in relation to F0-F1, F2-F3 and F4 fibrosis stage.
The box represents the interquartile range. The whiskers indicate the highest and lowest values, and the asterisks represent outliers. The line across the box indicates the median value. FI: Fibrosis index; GP: Globulin/platelet; FCI: Fibrosis-cirrhosis index; AST: Aspartate aminotransferase; APRI: AST-platelet ratio; AP index: Age-platelet count ratio.
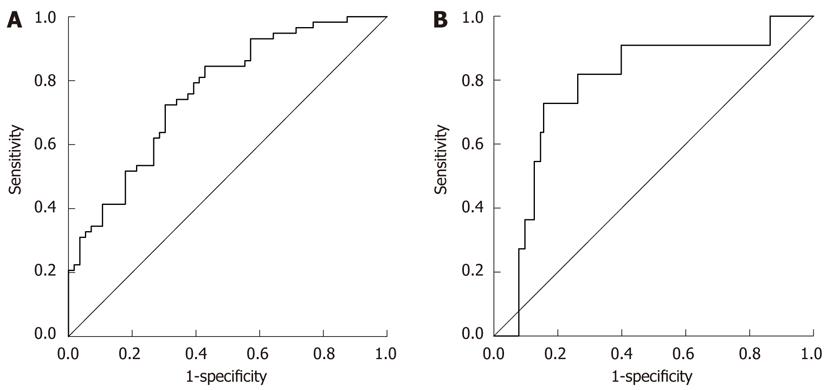
Figure 3 Receiver operating characteristic curves generated by globulin/platelet model for prediction of F0-F1 (A) and F4 (B).
The area under the curve of GP model for the discrimination between minimal fibrosis (F0-F1) and significant fibrosis (F2, F3, F4), and between non-cirrhosis (F0, F1, F2, F3) and cirrhosis (F4) was 0.732 [confidence interval (CI): 0.642-0.823] and 0.738 (CI: 0.612-0.864). Using a cutoff value of < 1.68, GP model had a sensitivity of 72.4%, a positive predictive value (PPV) of 71.2%, a specificity of 69.6%, and a negative predictive value (NPV) of 70.8% for the prediction of F0-F1. For the prediction of cirrhosis (F4) at a cutoff value of > 2.53, GP model had a sensitivity of 72.7%, a PPV of 33.4%, a specificity of 84.5%, and a NPV of 96.7%.
- Citation: Liu XD, Wu JL, Liang J, Zhang T, Sheng QS. Globulin-platelet model predicts minimal fibrosis and cirrhosis in chronic hepatitis B virus infected patients. World J Gastroenterol 2012; 18(22): 2784-2792
- URL: https://www.wjgnet.com/1007-9327/full/v18/i22/2784.htm
- DOI: https://dx.doi.org/10.3748/wjg.v18.i22.2784


