Copyright
©2012 Baishideng Publishing Group Co.
World J Gastroenterol. May 21, 2012; 18(19): 2415-2422
Published online May 21, 2012. doi: 10.3748/wjg.v18.i19.2415
Published online May 21, 2012. doi: 10.3748/wjg.v18.i19.2415
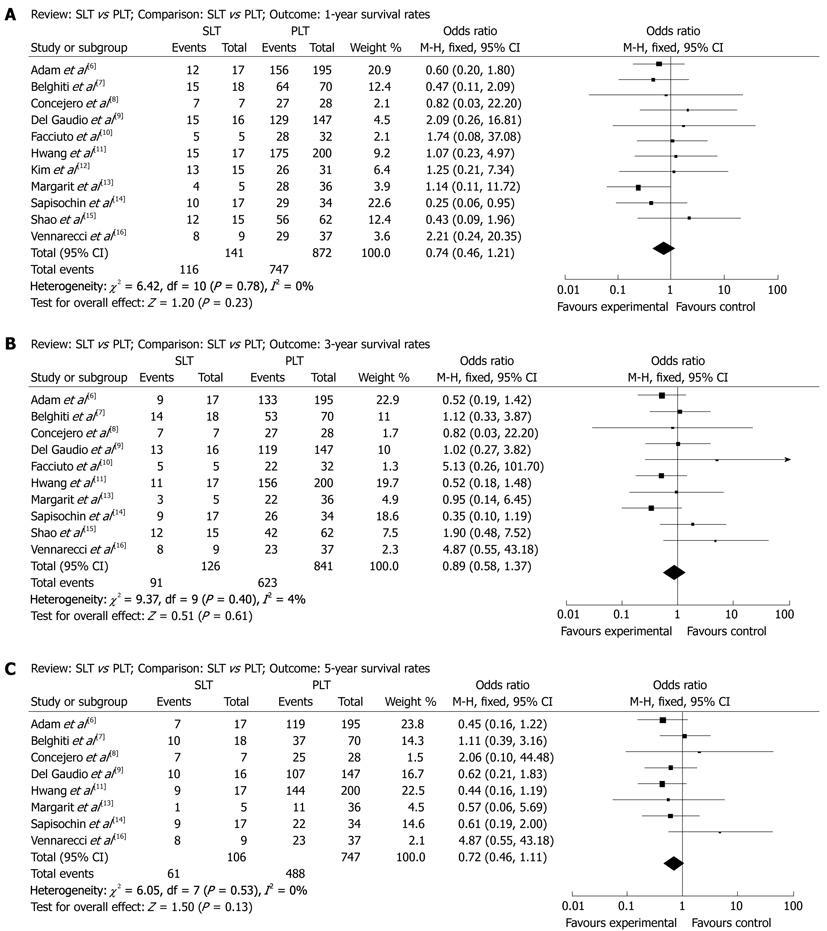
Figure 1 Fixed-effect model of odds ratio for 1-year survival rates (A), 3-year survival rates (B) and 5-year survival rates (C) after salvage liver transplantation and primary liver transplantation (Experimental: Salvage liver transplantation; Control: Primary liver transplantation).
SLT: Salvage liver transplantation; PLT: Primary liver transplantation.
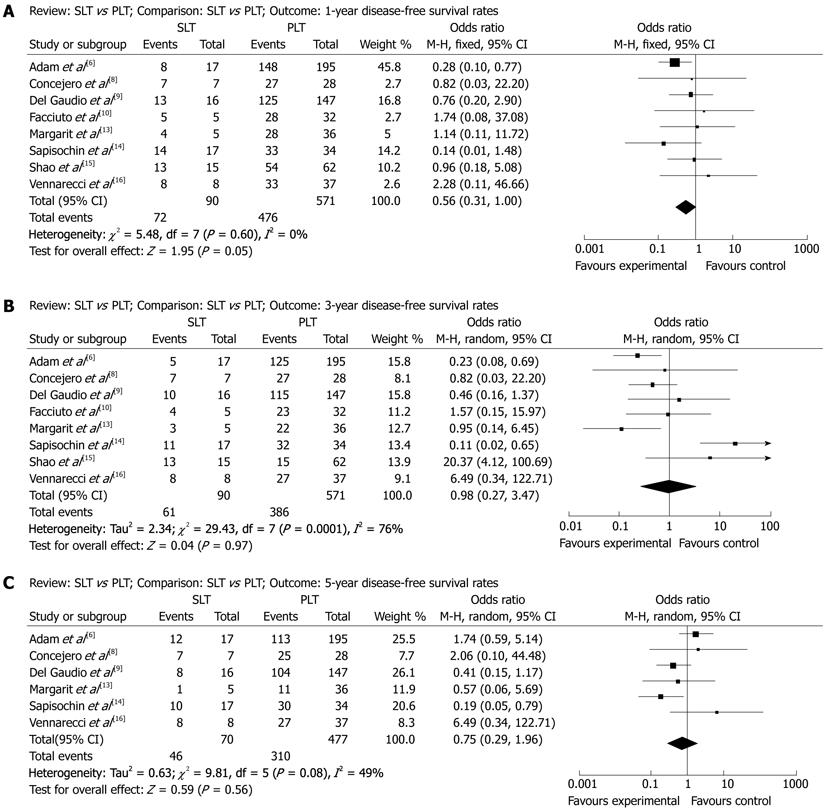
Figure 2 Fixed-effect model of odds ratio for 1-year disease-free survival rates (A); random-effect model of odds ratio for 3-year disease-free survival rates (B) and 5-year disease-free survival rates (C) after salvage liver transplantation and primary liver transplantation (Experimental: Salvage liver transplantation; Control: Primary liver transplantation).
SLT: Salvage liver transplantation; PLT: Primary liver transplantation.
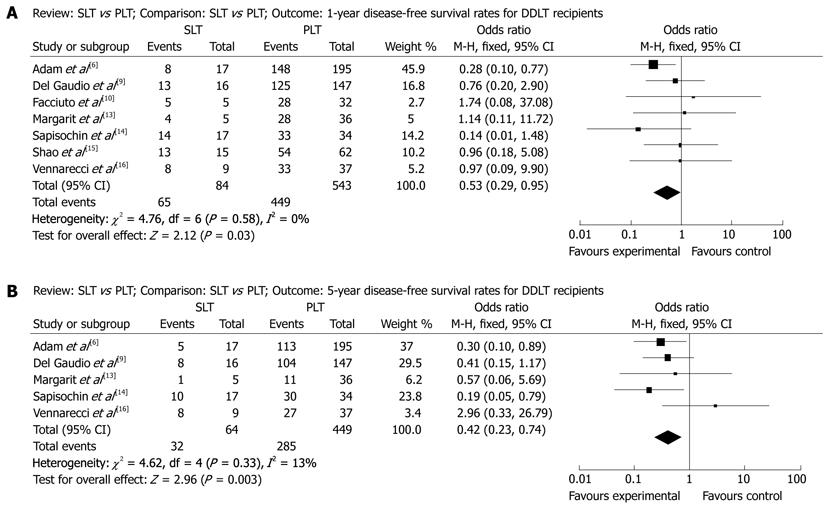
Figure 3 Fixed-effect model of odds ratio for 1-year (A) and 5-year (B) disease-free survival rates for deceased-donor liver transplantation recipients after salvage liver transplantation and primary liver transplantation (Experimental: Salvage liver transplantation; Control: Primary liver transplantation).
DDLT: Deceased-donor liver transplantation; SLT: Salvage liver transplantation; PLT: Primary liver transplantation.
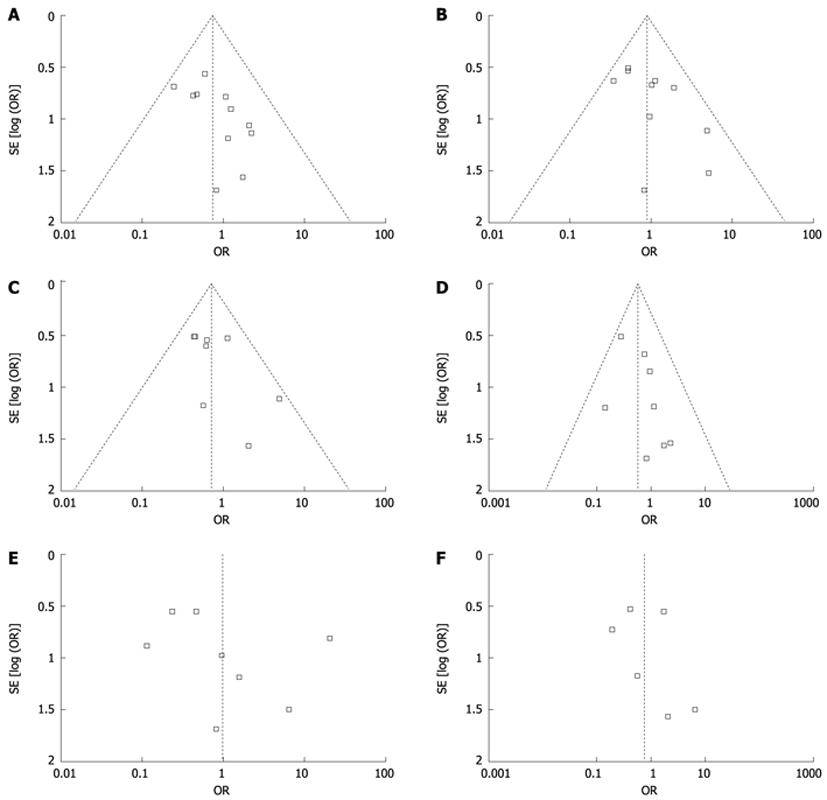
Figure 4 Funnel plot.
A: 11 articles in the meta-analysis of 1-year survival after treatment; B: 10 articles in the meta-analysis of 3-years survival after treatment; C: 8 articles in the meta-analysis of 5-years survival after treatment; D: 8 articles in the meta-analysis of 1-year disease-free survival after treatment; E: 8 articles in the meta-analysis of 3-year disease-free survival after treatment; F: 6 articles in the meta-analysis of 5-year disease-free survival after treatment. SE: Standard error; OR: Odds ratio.
- Citation: Li HY, Wei YG, Yan LN, Li B. Salvage liver transplantation in the treatment of hepatocellular carcinoma: A Meta-analysis. World J Gastroenterol 2012; 18(19): 2415-2422
- URL: https://www.wjgnet.com/1007-9327/full/v18/i19/2415.htm
- DOI: https://dx.doi.org/10.3748/wjg.v18.i19.2415


