Copyright
©2012 Baishideng Publishing Group Co.
World J Gastroenterol. May 21, 2012; 18(19): 2371-2376
Published online May 21, 2012. doi: 10.3748/wjg.v18.i19.2371
Published online May 21, 2012. doi: 10.3748/wjg.v18.i19.2371
Figure 1 Computed tomography showing a case of hilar bile duct carcinoma where the right hepatic lobe volume rate decreased from 68.
3% to 50.0% at 1 mo after percutaneous transhepatic portal vein embolization. A: Before percutaneous transhepatic portal vein embolization (PTPE) [right hepatic lobe (RHL) volume rate: 68.3%]; B: After PTPE (RHL volume rate: 50.0%); C: The portal vein in the RHL was completely occluded after PTPE.
Figure 2 Computed tomography showing a case of liver metastasis where the right hepatic lobe volume rate decreased from 66.
9% to 60.4%. A: Before portal vein ligation (PVL) [right hepatic lobe (RHL) volume rate: 66.9%]; B: After PVL (RHL volume rate: 60.4%); C: The right portal branch was intraoperatively ligated (arrow).
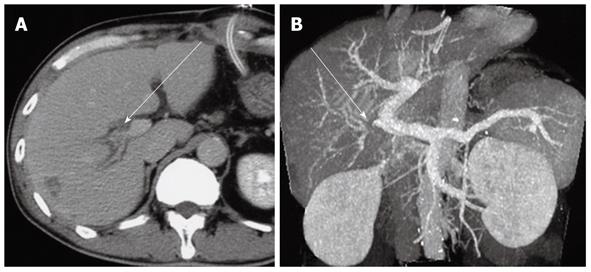
Figure 3 Postoperative computed tomography confirming a degree of residual portal venous flow from the periphery to the ligation point (arrow).
A: Axial image; B: Multiplanar reconstruction image.
Figure 4 Doppler ultrasound findings on hemodynamics.
A: Color Doppler ultrasound confirming portal venous flow from the anterior to the posterior branch (arrow); B: Pulse Doppler ultrasound confirming hepatofugal venous flow in the anterior branch (arrow); C: Pulse Doppler ultrasound confirming hepatopetal venous flow in the posterior branch (arrow).
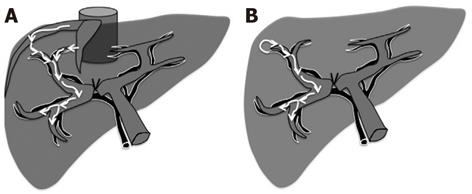
Figure 5 Hemodynamics during portal vein ligation procedure.
A: The residual portal venous flow may be explained as backflow from the hepatic vein; B: The presence of an arterioportal shunt may be another reason for the residual portal venous flow.
- Citation: Iida H, Aihara T, Ikuta S, Yoshie H, Yamanaka N. Comparison of percutaneous transhepatic portal vein embolization and unilateral portal vein ligation. World J Gastroenterol 2012; 18(19): 2371-2376
- URL: https://www.wjgnet.com/1007-9327/full/v18/i19/2371.htm
- DOI: https://dx.doi.org/10.3748/wjg.v18.i19.2371


