Copyright
©2012 Baishideng Publishing Group Co.
World J Gastroenterol. Apr 21, 2012; 18(15): 1773-1780
Published online Apr 21, 2012. doi: 10.3748/wjg.v18.i15.1773
Published online Apr 21, 2012. doi: 10.3748/wjg.v18.i15.1773
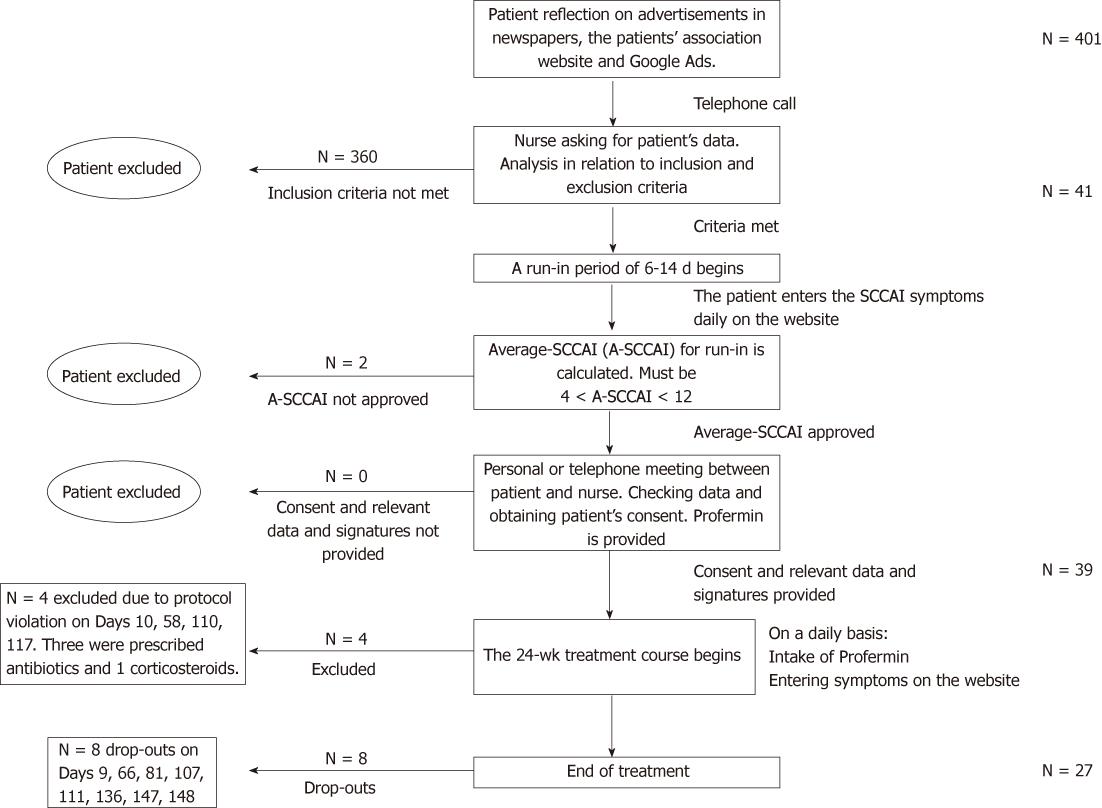
Figure 1 Patient flow diagram.
SCCAI: Simple Clinical Colitis Activity Index.
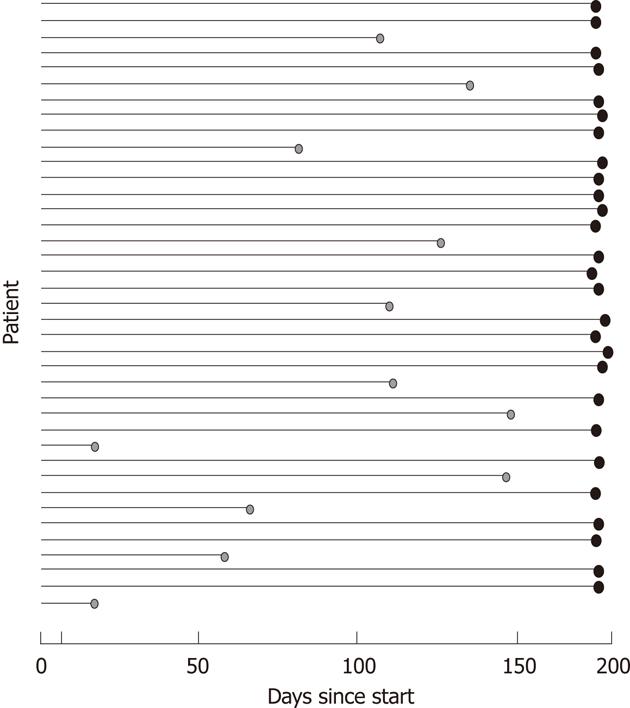
Figure 2 Point indicates that patient has dropped out.
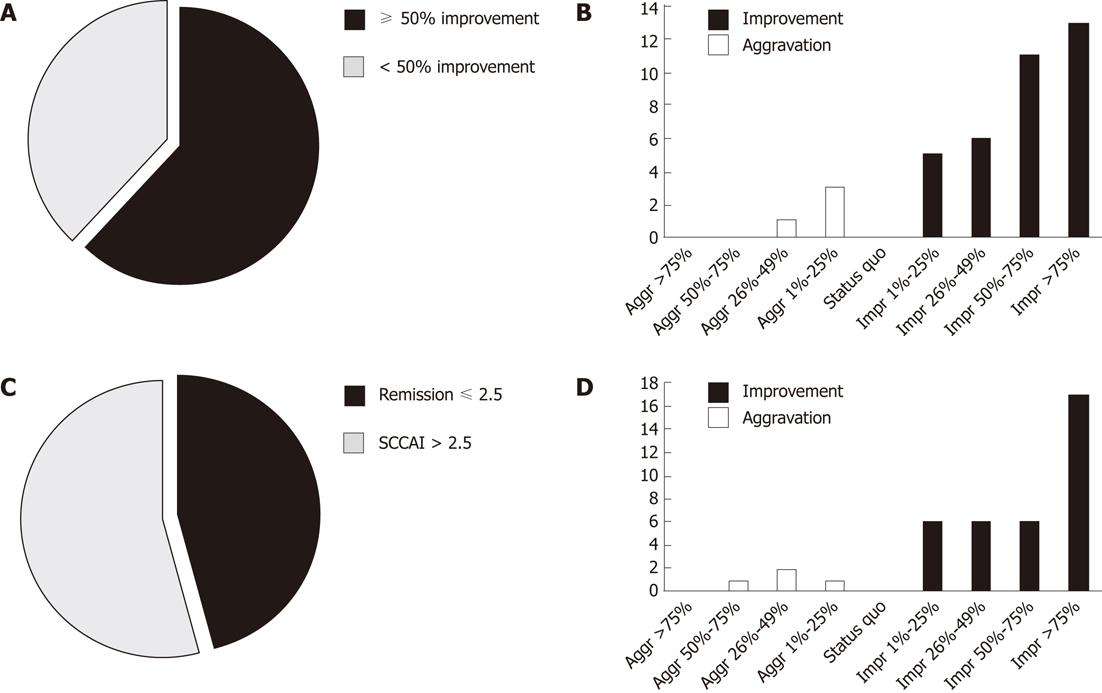
Figure 3 Intention to treat analysis of the primary (A, B) and secondary (C, D) endpoint.
A, B: Proportion of patients with ≥ 50% reduction in Simple Clinical Colitis Activity Index (SCCAI) at week 24 and the relative development in SCCAI score; A: The primary endpoint was in intention to treat (ITT) analysis reached by 24 in 39 patients (62%); B: Illustrates the relative development in SCCAI in the last week of observation compared to the run-in week; C, D: Remission at week 24 and the relative development in the 4 defecation scores; C: The secondary endpoint was in ITT analysis reached by 18 in 39 patients (46%); D: Illustrates the relative development in the 4 defecation scores in the SCCAI (Table 1) in the last week of observation compared to the run-in week.
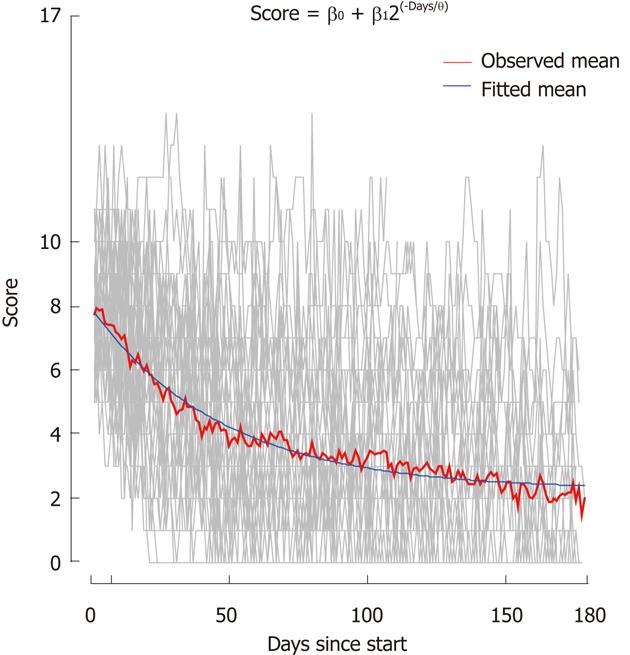
Figure 4 Development in Simple Clinical Colitis Activity Index score.
- Citation: Krag A, Israelsen H, Ryberg BV, Andersen KK, Bendtsen F. Safety and efficacy of Profermin® to induce remission in ulcerative colitis. World J Gastroenterol 2012; 18(15): 1773-1780
- URL: https://www.wjgnet.com/1007-9327/full/v18/i15/1773.htm
- DOI: https://dx.doi.org/10.3748/wjg.v18.i15.1773


