Copyright
©2012 Baishideng Publishing Group Co.
World J Gastroenterol. Apr 21, 2012; 18(15): 1745-1752
Published online Apr 21, 2012. doi: 10.3748/wjg.v18.i15.1745
Published online Apr 21, 2012. doi: 10.3748/wjg.v18.i15.1745
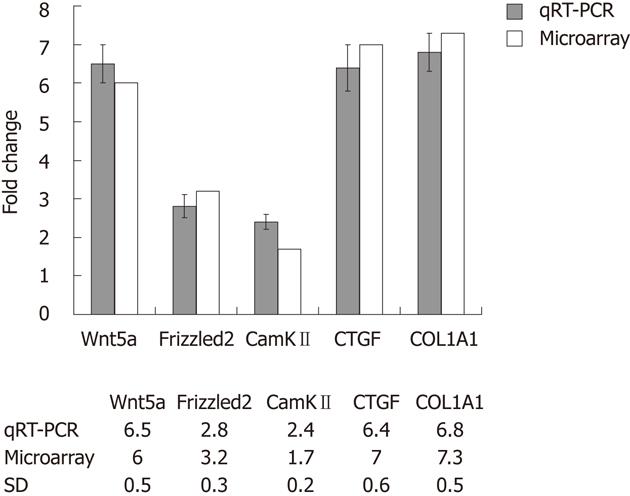
Figure 1 Validation of microarray data by quantitative real-time polymerase chain reaction.
Comparison between expression values of five selected differently expressed genes estimated by quantitative real-time polymerase chain reaction (qRT-PCR) and gene expression data. The detected changes measured by qRT-PCR reflected different changes in gene expression between quiescent and activated hepatic stellate cells obtained by microarray analysis. SD: Sprague Dawley; CTGF: Connective tissue growth factor; CamKII: Calcium calmodulin mediated kinaseII.
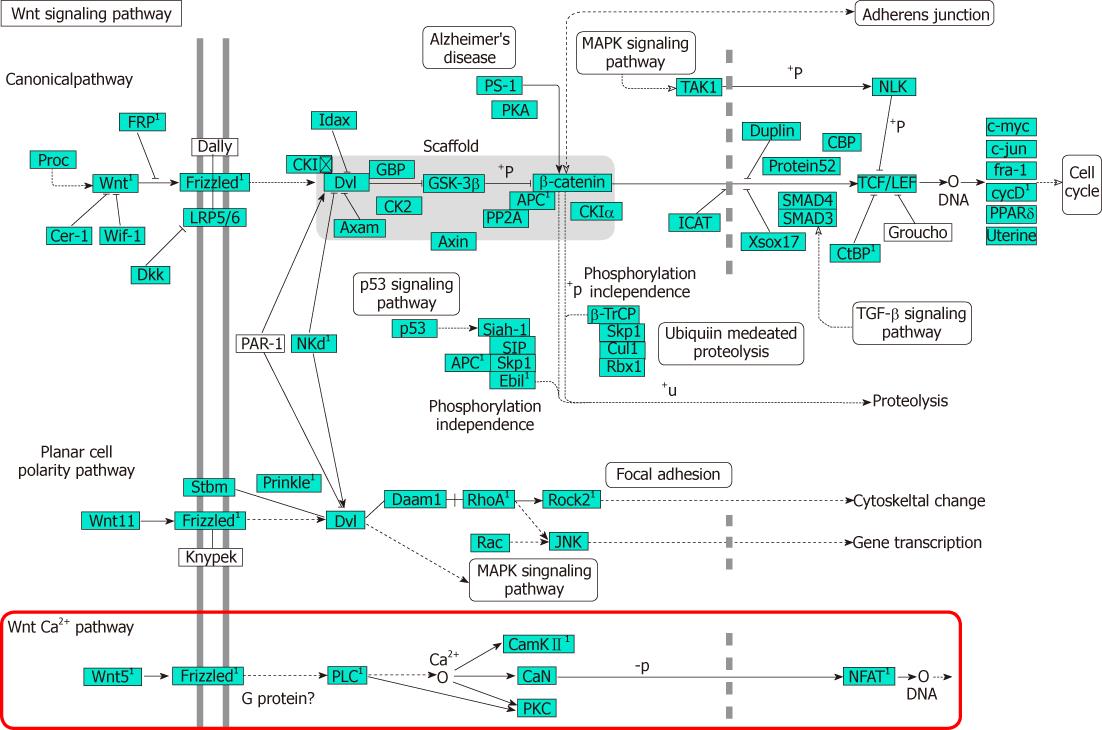
Figure 2 Wnt signaling pathway participated in the activation of hepatic stellate cells.
1Differentially expressed genes revealed by microarray. TGF-β1: Transforming growth factor-β1; PKC: Protein kinase; CamKII: Calcium calmodulin mediated kinase II; LRP: Low density lipoprotein receptor-related protein; GBP: Paternally expressed 12; APC: Adenomatous polyposis coli; CBP: CREB binding protein; PKC: Protein kinase C; NFAT: Nuclear factor of activated T cells; PLC: Phospholipase c.
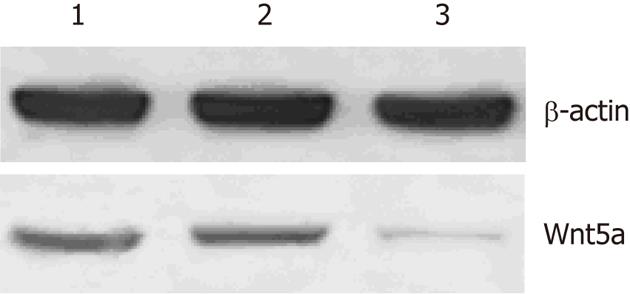
Figure 3 Expression levels of Wnt5a proteins in three groups detected by Western blotting.
1: Control; 2: Negative siRNA; 3: Wnt5a ShRNA.
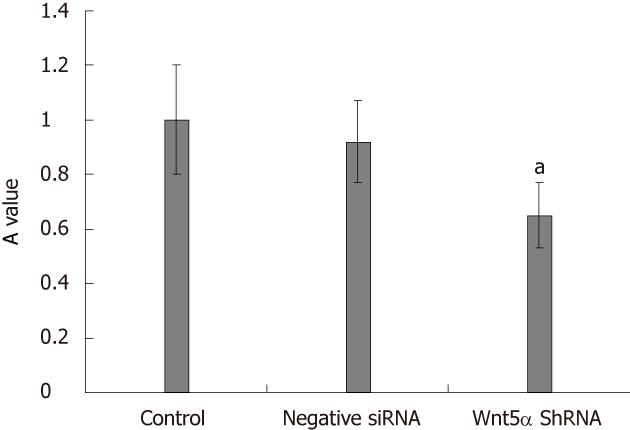
Figure 4 Knock down of Wnt5a decreases the cell proliferation.
The role of Wnt5a in regulating LX-2 proliferation was determined by 3-(4,5-dimethythiazol-2-yl)-2,5-diphenyl tetrazolium bromide assay. Compared with the negative siRNA and control group, Wnt5a ShRNA could inhibit the proliferation of LX-2, aP < 0.05.
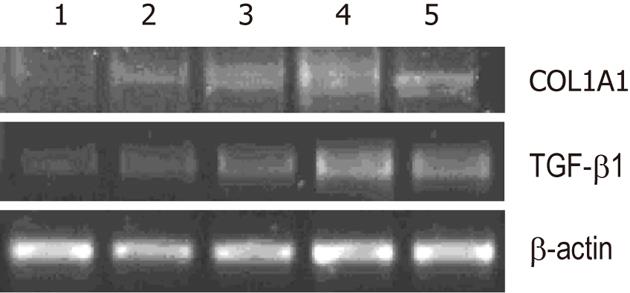
Figure 5 Knockdown of Wnt5a decreases expressions of α-1 type I collagen and transforming growth factor-β1.
Experiments were repeated three times and representative results are shown. Compared with the negative siRNA, vector and control groups, the expressions of α-1 type I collagen (COL1A1) and transforming growth factor-β1 (TGF-β1) mRNA were downregulated remarkably in the Wnt5a shRNA group (P < 0.05). 1: Wnt5a ShRNA multiplicity of infection (MOI) 20; 2: Wnt5a ShRNA MOI 10; 3: Negative siRNA; 4:Vector; 5: Control.
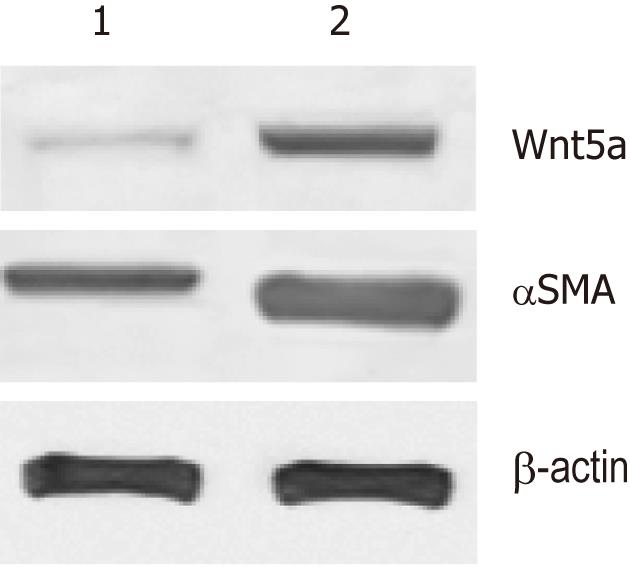
Figure 6 Expression of Wnt5a in fibrotic livers determined with Western blotting.
The bands were semi-quantitatively evaluated by densitometric analysis. Wnt5a protein was upregulated as significantly as αSMA in the CCl4-induced liver fibrosis model when compared with the normal rats (P < 0.01). 1: Normal group; 2: Model group.
- Citation: Xiong WJ, Hu LJ, Jian YC, Wang LJ, Jiang M, Li W, He Y. Wnt5a participates in hepatic stellate cell activation observed by gene expression profile and functional assays. World J Gastroenterol 2012; 18(15): 1745-1752
- URL: https://www.wjgnet.com/1007-9327/full/v18/i15/1745.htm
- DOI: https://dx.doi.org/10.3748/wjg.v18.i15.1745


