Copyright
©2012 Baishideng Publishing Group Co.
World J Gastroenterol. Apr 21, 2012; 18(15): 1732-1744
Published online Apr 21, 2012. doi: 10.3748/wjg.v18.i15.1732
Published online Apr 21, 2012. doi: 10.3748/wjg.v18.i15.1732
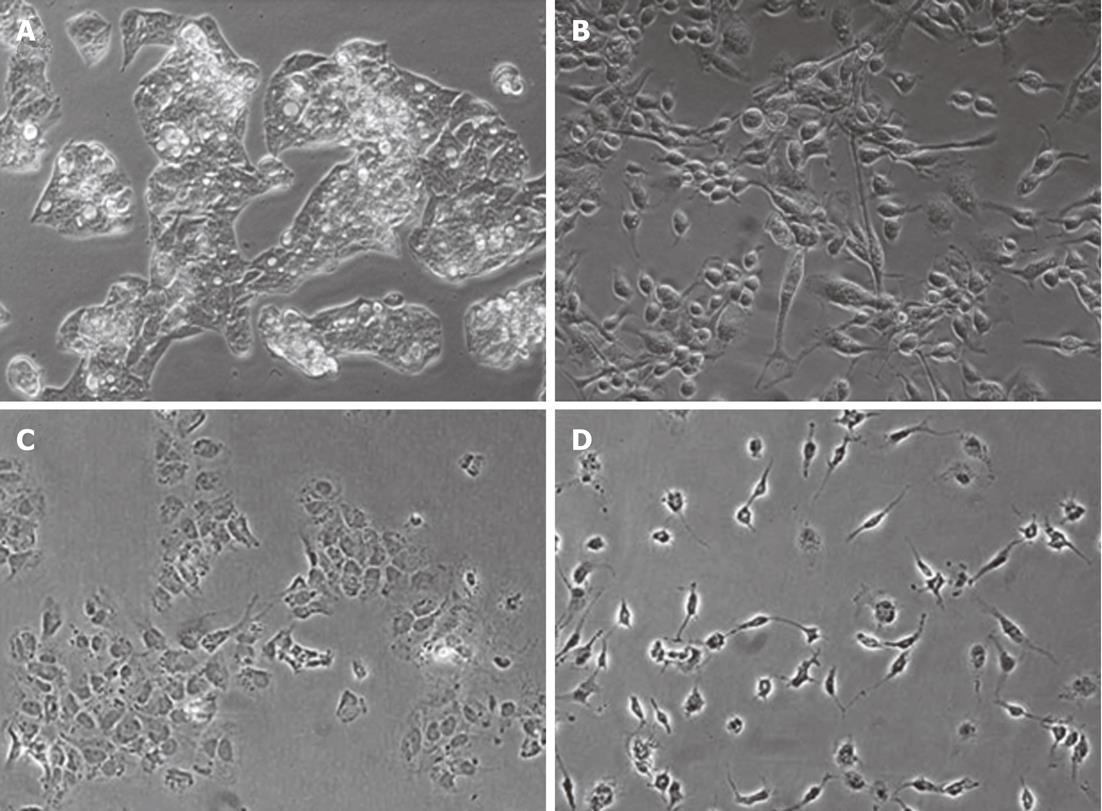
Figure 1 Macrophage-conditioned media induces a fibroblast-like morphological change in hepatocytes.
Phase contrast microscopy of HepG2 (A and B) and Huh7 cells (C and D) grown in complete media (A and C) or 50% macrophage-conditioned media in complete medium (B and D). The images shown are representative of six experiments of cells after 24 h of culture in the indicated medium.
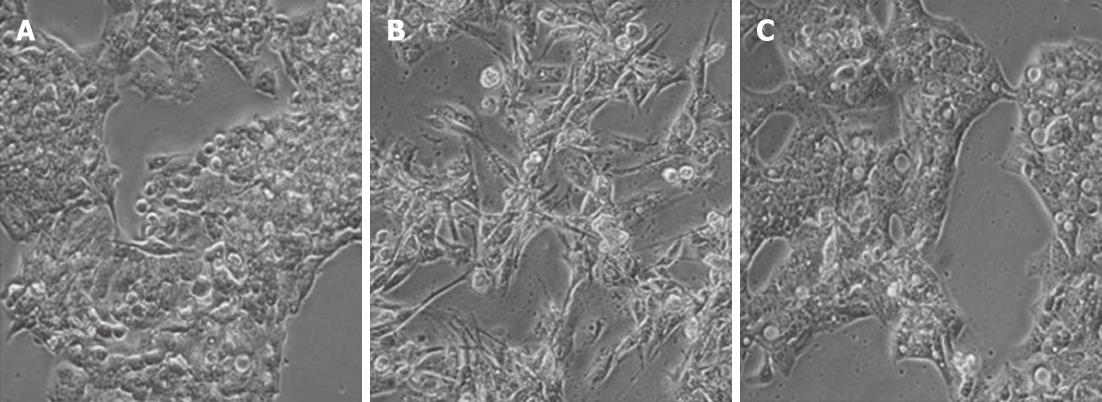
Figure 2 Macrophage-conditioned media induces a transient change in hepatocytes.
Phase contrast microscopy of HepG2 cells grown in complete media (A) for 72 h, macrophage-conditioned media (MφCM) for 72 h (B) or MφCM for 24 h followed by washing and culture in complete medium for a further 48 h (C). The images shown are representative of cells after 72 h of culture in the indicated medium.
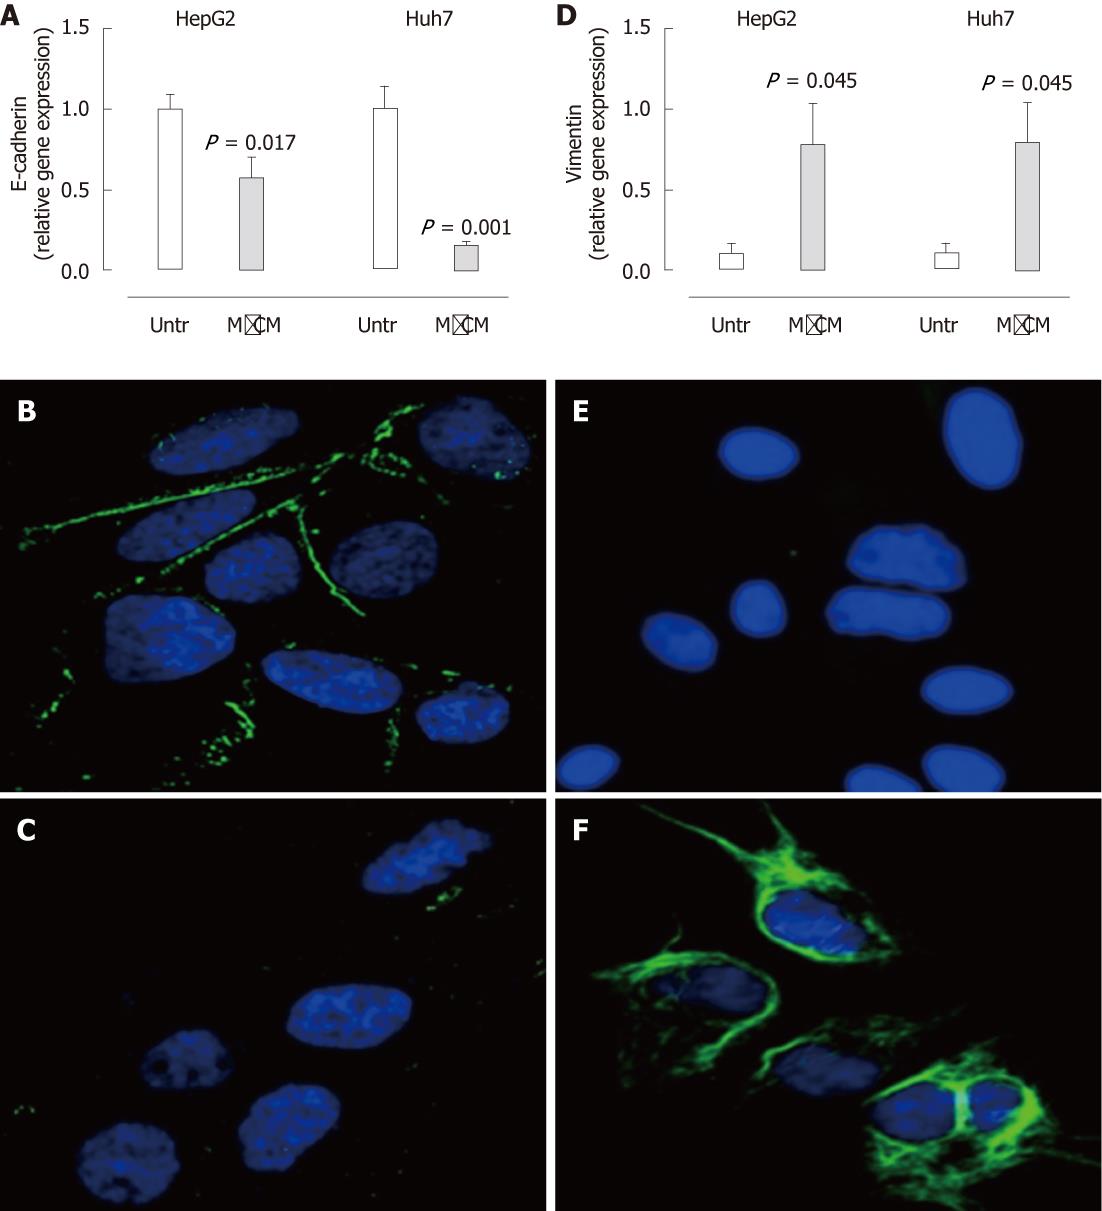
Figure 3 Expression of E-cadherin is reduced and vimentin is increased in hepatocytes treated with macrophage-conditioned media.
A, D: Following culture in complete media or 50% macrophage-conditioned media (MφCM) for 24 h, E-cadherin (A) and vimentin (D) mRNA levels in HepG2 and Huh7 cells were measured by real-time polymerase chain reaction. Results are expressed as fold of untreated cells (mean ± SEM, n = 8) (P < 0.05 vs untreated); B, C: Immunofluorescence staining for E-cadherin (green) in untreated (B) and MφCM-treated (C) Huh7 cells; E, F: Immunofluorescence staining for vimentin (green) in untreated (E) and MφCM-treated (F) Huh7 cells. 4',6-diamidino-2-phenylindole stained nuclei blue (63 × magnification). Untr: Untreated.
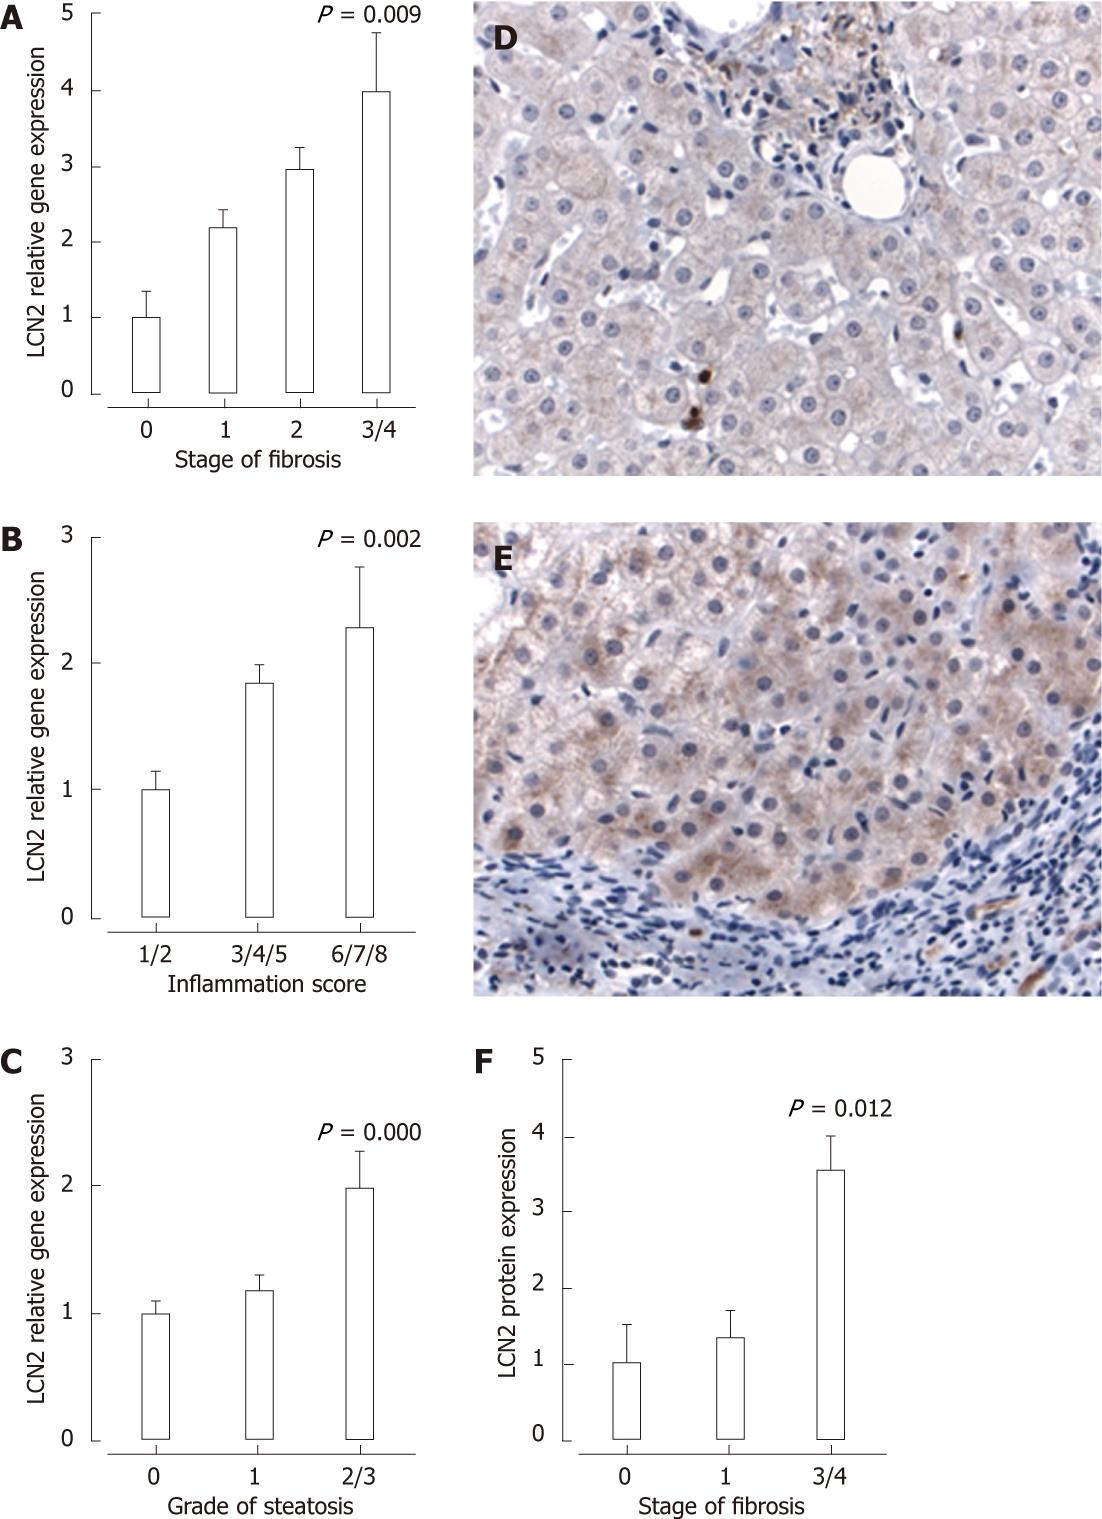
Figure 4 Lipocalin-2 mRNA expression was increased in hepatitis C virus-infected patients with increasing stage of fibrosis (A), grade of inflammation (B) or grade of steatosis (C).
D and E: Lipocalin-2 (LCN2) staining by immunohistochemistry was minimal in hepatitis C virus (HCV)-infected patients with stage 1 fibrosis (D; 400 × magnification) compared with stage 4 fibrosis (E; 400 × magnification); F: Increased LCN2 protein expression in HCV-infected patients with stage 3/4 fibrosis. P < 0.05 vs fibrosis stage 0 (A), inflammation grade 1/2 (B) steatosis grade 0 (C) or fibrosis stage 1 (D).
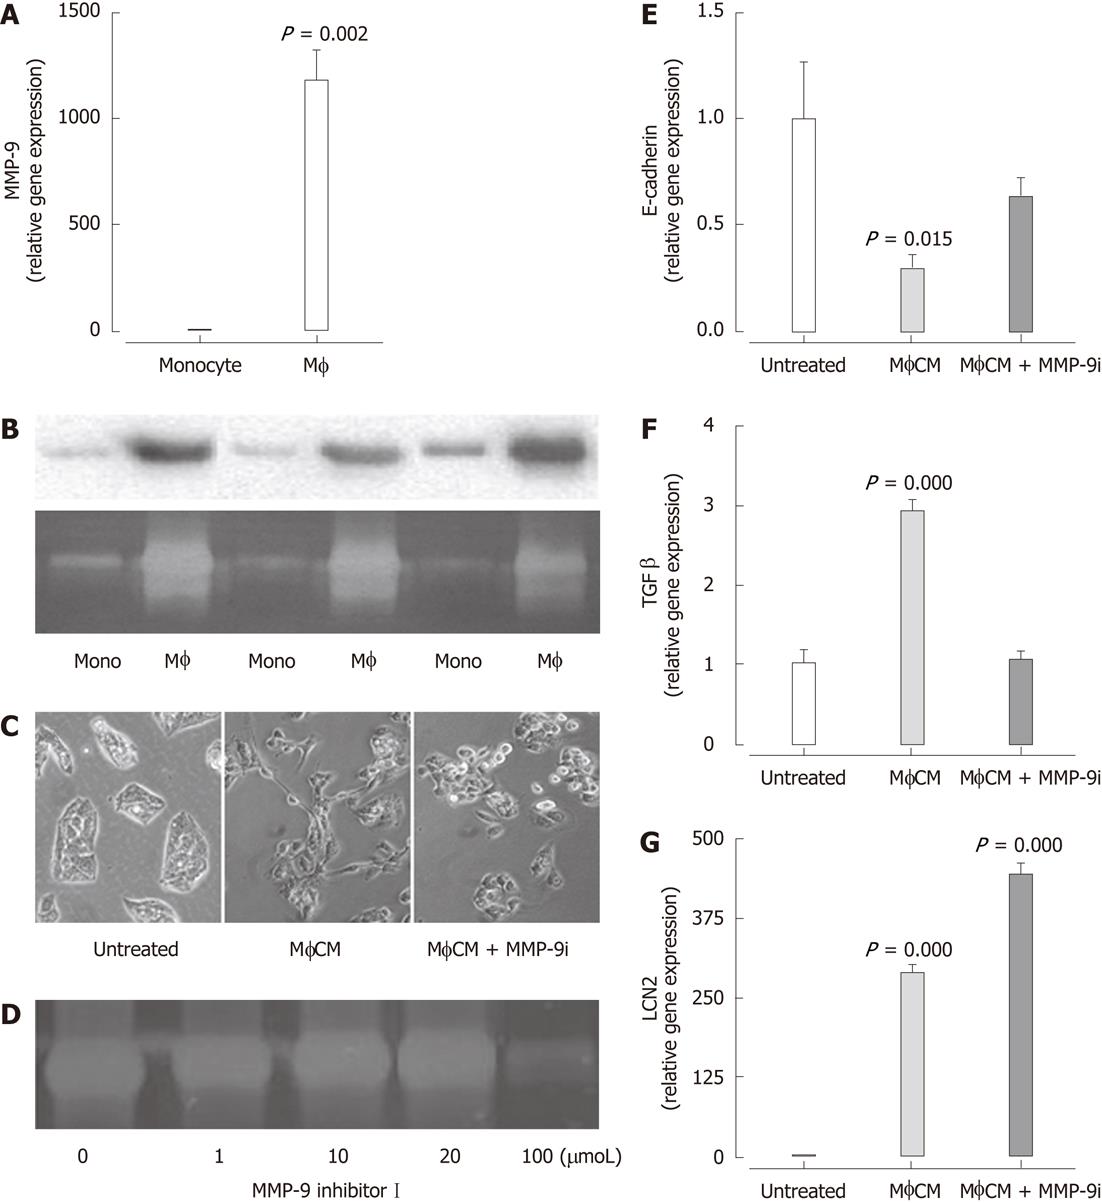
Figure 5 Matrix metalloproteinase-9 mRNA expression is significantly increased in macrophages compared with THP-1 monocytes.
A: Results are expressed as fold of monocytes (mean ± SEM, n = 6) (P < 0.05 vs monocytes); B: Western blotting analysis (top) and zymography (bottom) of matrix metalloproteinase (MMP)-9 in MonoCM and macrophage-conditioned media (MφCM) from three independent experiments; C: Generation of MφCM in the presence of MMP-9 inhibitor I (100 μmol) prevented the MφCM-induced morphological change in HepG2 cells; D: Zymography gel confirming MMP-9 inhibitor I reduces MMP-9 activity in MφCM at 100 μmol; E-G: MMP-9 Inhibitor I significantly attenuated downregulation of E-cadherin (E) and upregulation of transforming growth factor-β1 (TGF-β1) (F) but not lipocalin-2 (LCN2) (G) mRNA expression in response to MφCM. Results are expressed as fold of untreated cells (mean ± SEM, n = 5), P < 0.05 vs untreated.
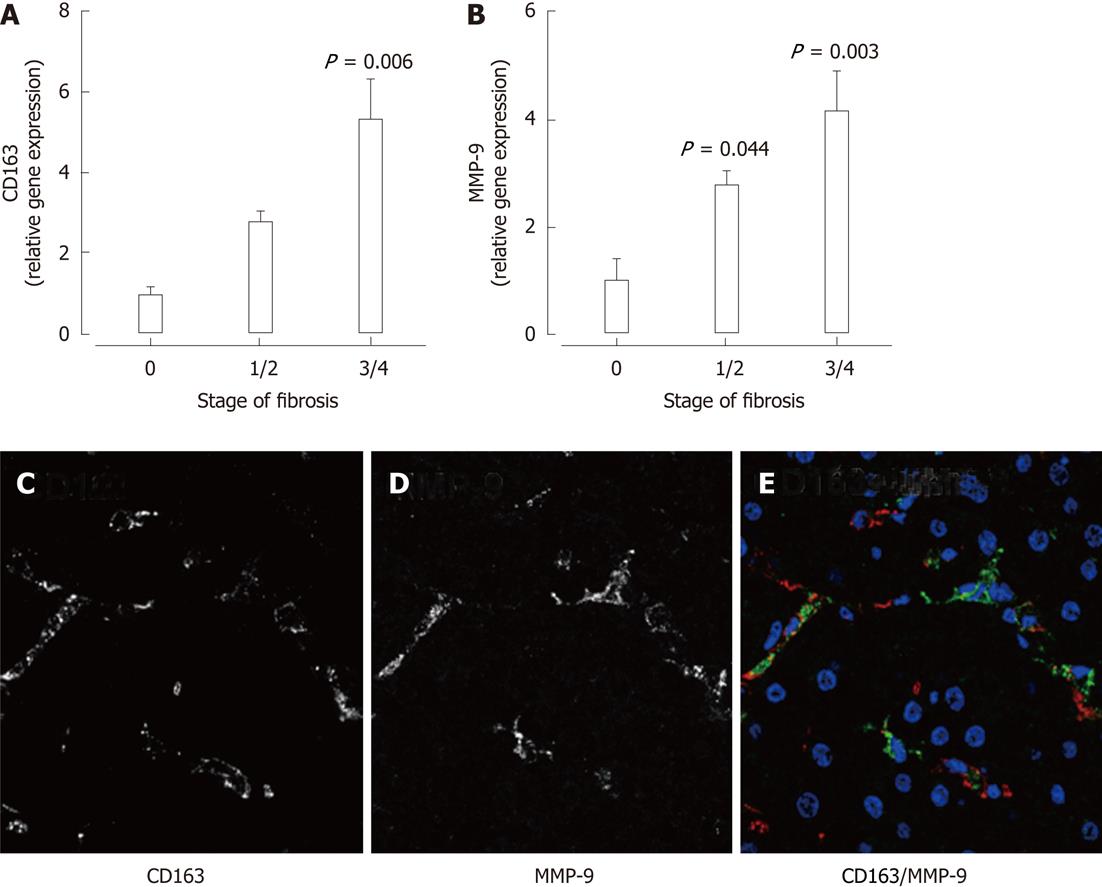
Figure 6 In patients with chronic hepatitis C, increased hepatic mRNA expression of the macrophage marker CD163 (A) as well as matrix metalloproteinase-9 (B) was significantly associated with increasing stage of fibrosis (P < 0.
05 vs F0). C-E: Immunofluorescence in liver biopsies from patients with chronic hepatitis C demonstrated matrix metalloproteinase (MMP)-9 expression in CD163+ macrophages.
- Citation: Melino M, Gadd VL, Walker GV, Skoien R, Barrie HD, Jothimani D, Horsfall L, Jones A, Sweet MJ, Thomas GP, Clouston AD, Jonsson JR, Powell EE. Macrophage secretory products induce an inflammatory phenotype in hepatocytes. World J Gastroenterol 2012; 18(15): 1732-1744
- URL: https://www.wjgnet.com/1007-9327/full/v18/i15/1732.htm
- DOI: https://dx.doi.org/10.3748/wjg.v18.i15.1732


