Copyright
©2012 Baishideng Publishing Group Co.
World J Gastroenterol. Apr 7, 2012; 18(13): 1502-1507
Published online Apr 7, 2012. doi: 10.3748/wjg.v18.i13.1502
Published online Apr 7, 2012. doi: 10.3748/wjg.v18.i13.1502
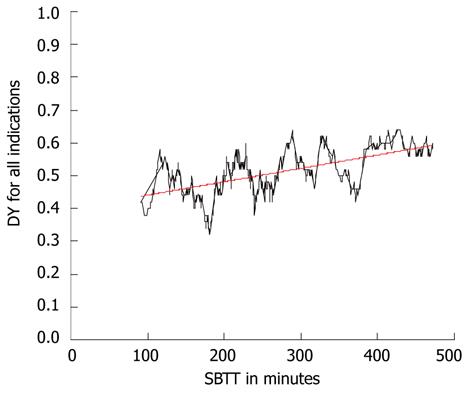
Figure 1 Correlation between the small bowel transit time in minutes and the diagnostic yield for all patients.
Spearman’s rho coefficient 0.58 ( P < 0.01) shown by the black line. The trend of this correlation is shown by the red line. DY: Diagnostic yield; SBTT: Small bowel transit time.
Figure 2 Correlation between the small bowel transit time in minutes and the diagnostic yield in patient with complete capsule endoscopy.
Spearman’s rho coefficient 0.40 (P < 0.01) shown by the black line. The trend of this correlation is shown by the red line. DY: Diagnostic yield; SBTT: Small bowel transit time.
Figure 3 Correlations between small bowel transit time and diagnostic yield.
A: Obscure gastrointestinal bleeding (OGIB; r = 0.54, P < 0.01); B: Suspected Crohn’s disease (r = -0.40); C: Polyposis plus carcinoid (r = 0.56, P < 0.01); D: Other indications (r = 0.90, P < 0.01), shown by the black line. The trend of this correlation is shown by the red line. DY: Diagnostic yield; SBTT: Small bowel transit time.
- Citation: Westerhof J, Koornstra JJ, Hoedemaker RA, Sluiter WJ, Kleibeuker JH, Weersma RK. Diagnostic yield of small bowel capsule endoscopy depends on the small bowel transit time. World J Gastroenterol 2012; 18(13): 1502-1507
- URL: https://www.wjgnet.com/1007-9327/full/v18/i13/1502.htm
- DOI: https://dx.doi.org/10.3748/wjg.v18.i13.1502


