Copyright
©2012 Baishideng Publishing Group Co.
World J Gastroenterol. Mar 14, 2012; 18(10): 1130-1136
Published online Mar 14, 2012. doi: 10.3748/wjg.v18.i10.1130
Published online Mar 14, 2012. doi: 10.3748/wjg.v18.i10.1130
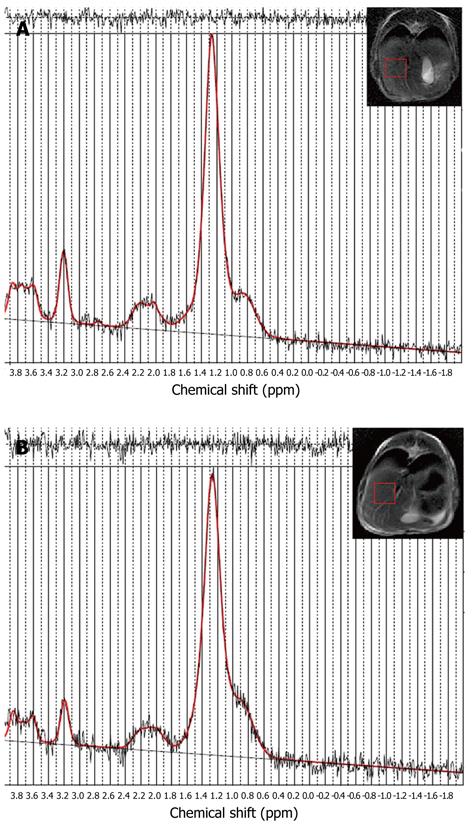
Figure 1 LCModel output of point-resolved spectroscopy-localized single-voxel 1H magnetic resonance spectra from the liver of one rabbit before (A) and after injection of sodium selenite (B).
The locations of the spectroscopic volume of interest are indicated by the squares in the Propeller FSE T2W image. The decreased choline-to-water area was observed.
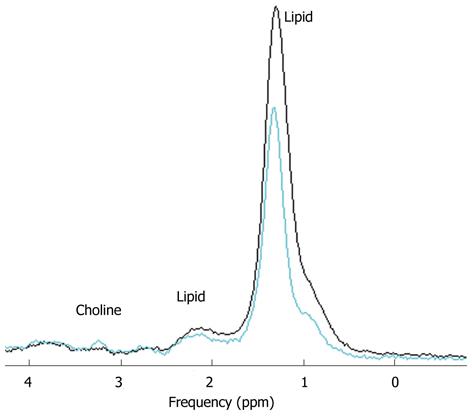
Figure 2 1H magnetic resonance spectra from a rabbit liver before (green line) and after injection of sodium selenite (black line).
The decreased choline peak was observed at 3.2 ppm. However, the choline peak from the liver after injection of sodium selenite was too weak, with a choline SD > 20%.
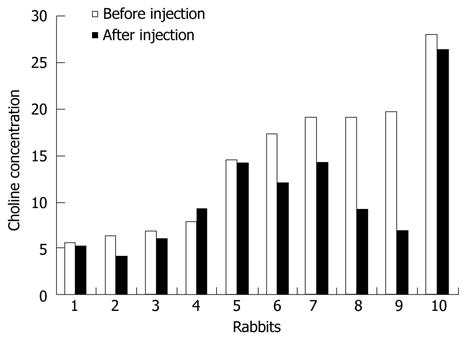
Figure 3 Barplot shows the choline concentration of livers from 10 rabbits before and after injection of sodium selenite.
The two-sample Wilcoxon test revealed significant differences between the groups (Z = -2.395, P < 0.05).
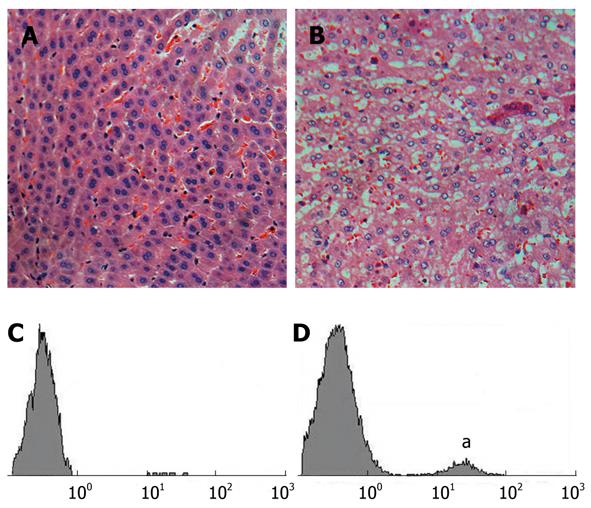
Figure 4 Light microscopy of representative hematoxylin and eosin stained histological sections of liver (A and B, x 200) and flow cytometry of liver apoptotic cells stained by dUTP-biotin nick end labeling assay (C and D).
A, C: Normal rabbits; B, D: Rabbits injected with sodium. The elevated apoptotic cell peak labeled by A was observed.
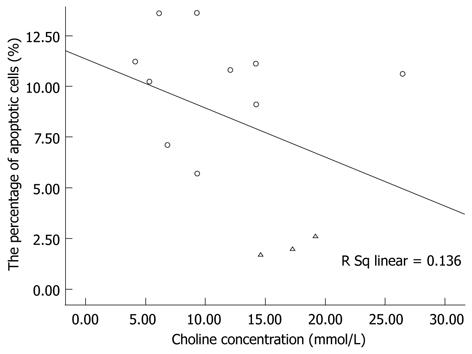
Figure 5 Scatter diagram shows the correlation between the percentage of apoptotic cells and choline concentration in the control group (Δ) and the experiment group after injection of sodium selenite (ο).
The linear regression analysis revealed no significant linear relationship between variables (R = 0.369, F = 1.734, P > 0.05).
- Citation: Shen ZW, Cao Z, You KZ, Yang ZX, Xiao YY, Cheng XF, Chen YW, Wu RH. Quantification of choline concentration following liver cell apoptosis using 1H magnetic resonance spectroscopy. World J Gastroenterol 2012; 18(10): 1130-1136
- URL: https://www.wjgnet.com/1007-9327/full/v18/i10/1130.htm
- DOI: https://dx.doi.org/10.3748/wjg.v18.i10.1130


