Copyright
©2011 Baishideng Publishing Group Co.
World J Gastroenterol. Feb 28, 2011; 17(8): 976-986
Published online Feb 28, 2011. doi: 10.3748/wjg.v17.i8.976
Published online Feb 28, 2011. doi: 10.3748/wjg.v17.i8.976
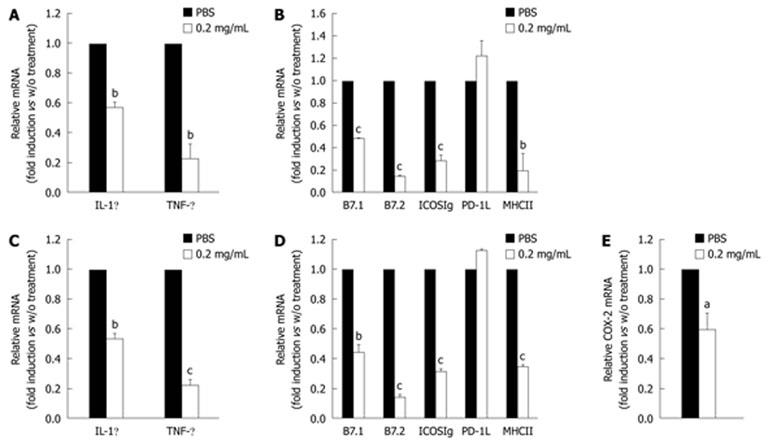
Figure 1 Treatment of cinnamon extract inhibits maturation of macrophage cell line.
Murine Raw 264.7 macrophages were stimulated with PMA/ionomycin in the absence or presence of 0.2 mg/mL cinnamon extract. Expression levels of cytokines (A) and co-stimulatory molecules (B) were measured by quantitative real-time PCR. To mimic in vivo stimulation, cells were treated with lipopolysaccharide alone or in combination with 0.2 mg/mL cinnamon extract. Expression level of cytokines (C), co-stimulatory molecules (D) and cyclooxygenase (COX)-2 (E) was measured by quantitative real-time PCR. Error bars indicated SD. aP < 0.05, bP < 0.005, cP < 0.001. Data are representative of three individual experiments.
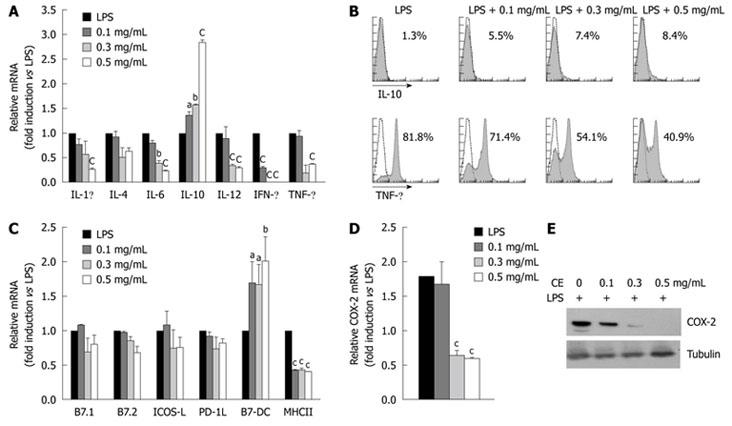
Figure 2 Treatment with cinnamon extract inhibits maturation of MHCII+ APCs.
MHCII+ APCs were stimulated with lipopolysaccharide (LPS) alone or in combination with cinnamon extract (0.1, 0.3 and 0.5 mg/mL). Expression levels of cytokines (A) and co-stimulatory molecules (C) were measured by quantitative real-time PCR. B: Intracellular expression levels of interleukin (IL)-10 and tumor necrosis factor (TNF)-α proteins were analyzed by flow cytometry. Effect of cinnamon extract treatment on cyclooxygenase (COX)-2 expression at the mRNA (D) and protein (E) level was measured by quantitative real-time PCR and immunoblotting, respectively. Error bars indicated SD. aP < 0.05, bP < 0.005, cP < 0.001. Data are representative of three individual experiments. IFN: Interferon.
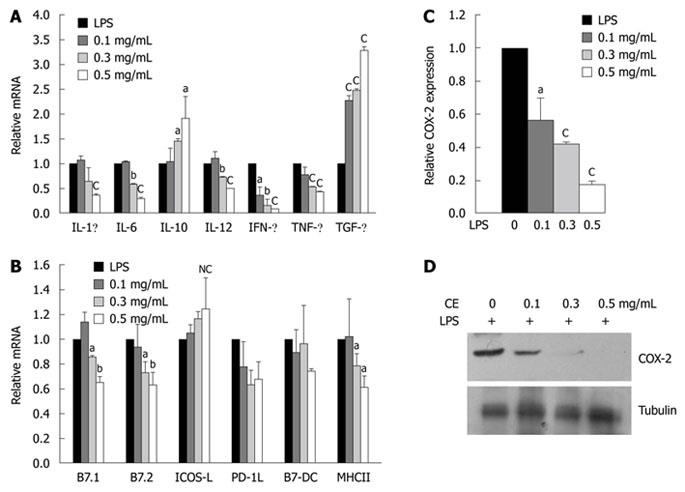
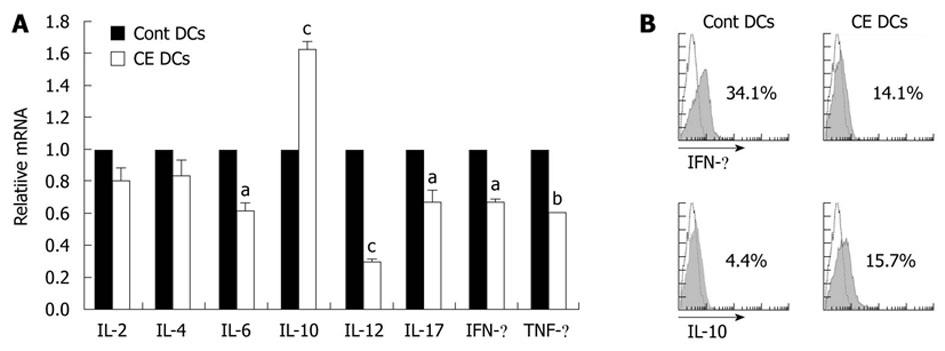
Figure 3 Treatment of cinnamon extract inhibits maturation of CD11+ dendritic cells.
CD11+ dendritic cells (DCs) were stimulated in the absence or presence of cinnamon extract (CE) and expression levels of cytokines [interleukin (IL)-1β, IL-4, IL-6, IL-10, IL-12, interferon (IFN)-γ, tumor necrosis factor (TNF)-α and transforming growth factor (TGF)-β] (A) and co-stimulatory molecules (B7.1, B7.2, ICOS ligand, B7-DC and MHCII) (B) were measured by quantitative real-time PCR. Effect of cinnamon extract (CE) treatment on cyclooxygenase (COX)-2 expression at the RNA (C) and protein (D) level was measured by quantitative real-time PCR and immunoblotting, respectively. Error bars indicated SD. aP < 0.05, bP < 0.005, cP < 0.001. Data are representative of three independent experiments.
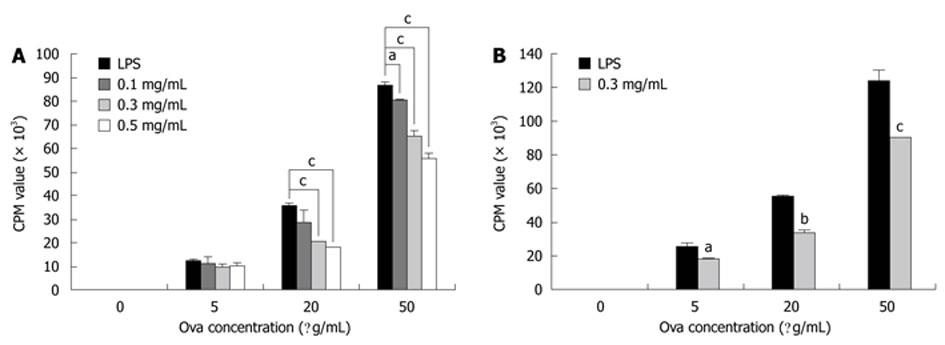
Figure 4 Treatment with cinnamon extract inhibits APC-dependent T-cell proliferation.
APC-dependent T-cell proliferation was measured. MHCII+ APCs (A) and CD11c+ dendritic cells (DCs) (B) were pre-pulsed in the absence or presence of cinnamon extract for 24 h. Then, they were co-cultured with CD4+ T cells isolated from Do11.10 mice in the presence of Ova peptide. After 72 h co-culture, T-cell proliferation was measured by [H3]-thymidine incorporation assay. Error bars indicated SD. aP < 0.05, bP < 0.005, cP < 0.001. Data are representative of three independent experiments.
Figure 5 Cinnamon-extract-treated dendritic cells inhibit Th1 polarization.
CD11c+ dendritic cells (DCs) were pre-pulsed with lipopolysaccharide (LPS) alone or in combination with cinnamon extract (CE) (0.2 mg/mL) for 24 h. Then, they were co-cultured with CD4+ T cells isolated from Do11.10 mice. A: After 72 h co-culture, CD4+ T cells were re-isolated from each treatment group and relative expression levels of cytokine mRNA were measured by quantitative real-time PCR; B: Intracellular protein levels of interleukin (IL)-10 and interferon (IFN)-γ in CD4+ T cells in each treatment group was analyzed by flow cytometry. Error bars indicated SD. aP < 0.05, bP < 0.005, cP < 0.001. Data are representative of three independent experiments.
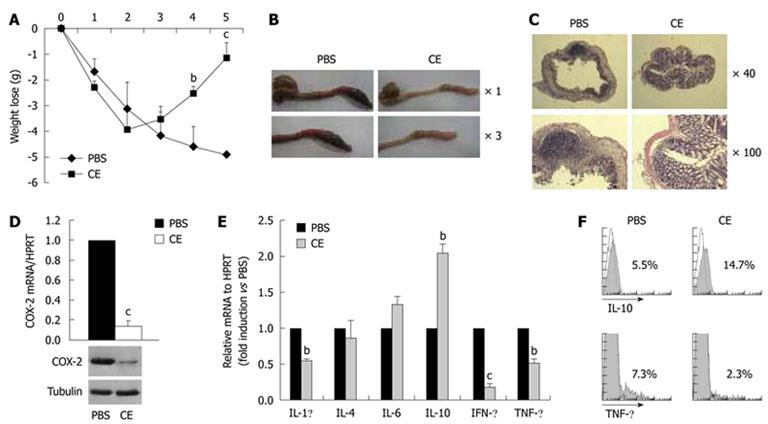
Figure 6 Oral administration of cinnamon extract ameliorates experimental colitis.
Mice were orally fed with PBS or cinnamon extract (CE) (50 μg/g per day) for 20 d, and intestinal colitis was induced by intrarectal injection of TNBS (50 μg/g in 50% ethanol). A: A change in body weight was monitored for 5 d; B: Gross intestinal changes were analyzed with a magnifying glass 3 d after colitis induction; C: After HE staining, histological analysis was performed by comparing colon sections of treatment groups; D: After induction of inflammatory bowel disease, cyclooxygenase (COX)-2 expression in mesenteric lymph nodes was compared by quantitative real-time PCR and immunoblotting; E: Expression levels of cytokines in mesenteric lymphocytes were measured by quantitative real-time PCR; F: Intracellular protein levels of interleukin (IL)-10 and tumor necrosis factor (TNF)-α were measured by flow cytometry. Error bars indicated SD. bP < 0.005, cP < 0.001. Data are representative of three independent experiments. IFN: Interferon.
- Citation: Kwon HK, Hwang JS, Lee CG, So JS, Sahoo A, Im CR, Jeon WK, Ko BS, Lee SH, Park ZY, Im SH. Cinnamon extract suppresses experimental colitis through modulation of antigen-presenting cells. World J Gastroenterol 2011; 17(8): 976-986
- URL: https://www.wjgnet.com/1007-9327/full/v17/i8/976.htm
- DOI: https://dx.doi.org/10.3748/wjg.v17.i8.976


