Copyright
©2011 Baishideng Publishing Group Co.
World J Gastroenterol. Feb 28, 2011; 17(8): 968-975
Published online Feb 28, 2011. doi: 10.3748/wjg.v17.i8.968
Published online Feb 28, 2011. doi: 10.3748/wjg.v17.i8.968
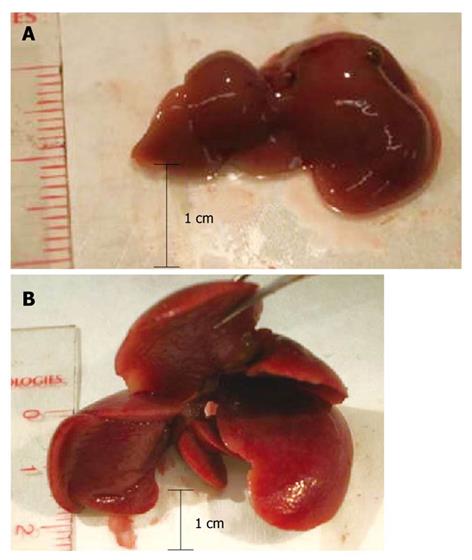
Figure 1 Representative livers from normal control mice (A), and mice with stage 3 amyloidosis (B).
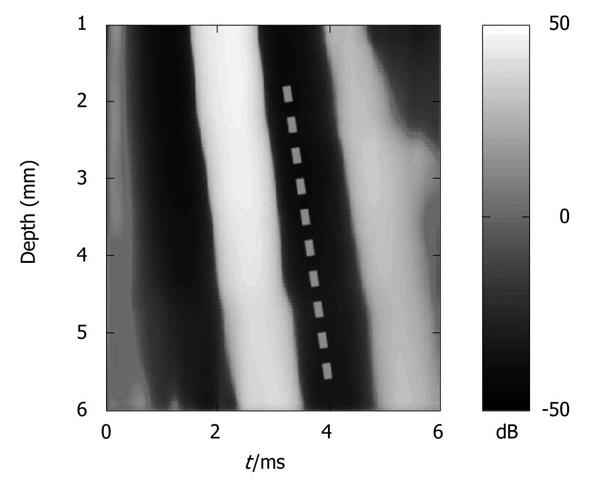
Figure 2 Amplitude of the strains induced in the liver of a mouse with systemic amyloidosis (stage 1), as a function of depth and time.
The shear wave velocity (VS) is the slope of the wave pattern. The steeper the slope, the higher the velocity of the shear wave and the higher the Young’s modulus (here E = 79.3 kPa).
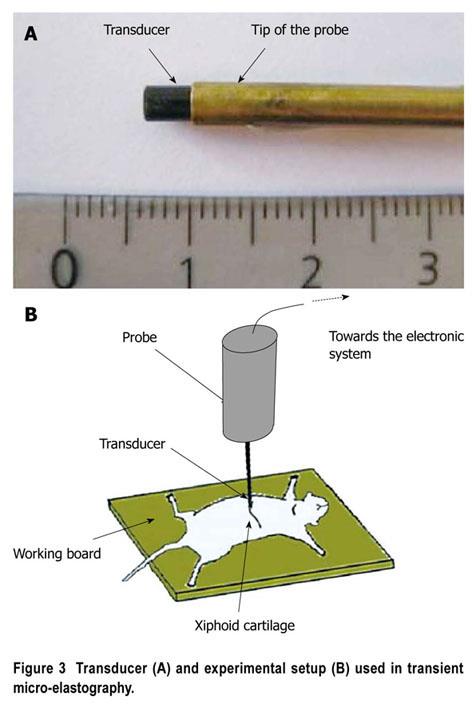
Figure 3 Transducer (A) and experimental setup (B) used in transient micro-elastography.
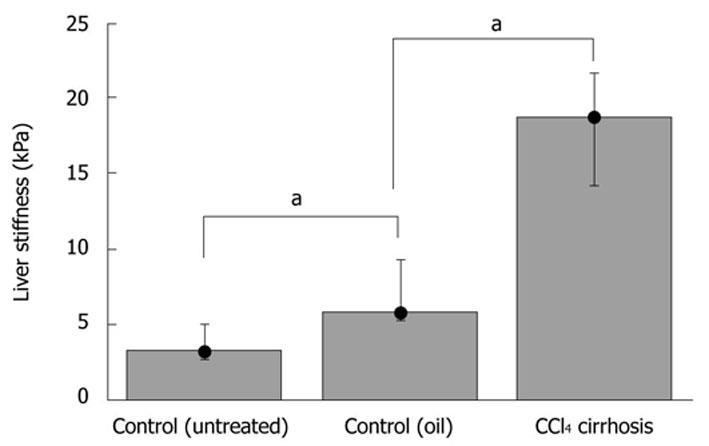
Figure 4 Bar plot showing median liver stiffness in control (untreated vs oil-treated) and CCl4-induced fibrosis.
Liver stiffness is expressed in kPa. Whiskers indicate the extent of the data. The difference between the groups is significant (aP≤ 0.05, Mann-Whitney).
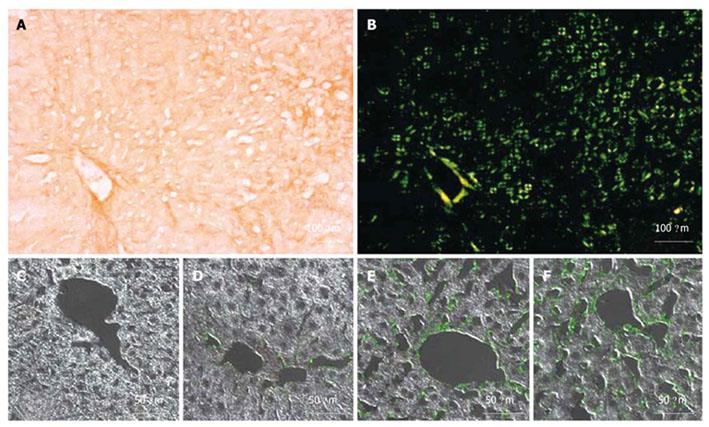
Figure 5 Histological characterization of amyloidosis mice.
Light microscopy of a liver section from a 6-mo-old K mouse stained with Congo red (A) and the same section under polarized light showing green birefringence (B); Confocal microscopy of liver sections with immunolocalization of mutant hapoA-II using an anti hapoA-II antibody and CY2 as the secondary antibody (green fluorescence): Control mouse, 8 mo old (C); K mouse, 2 mo old (D); K mouse, 6 mo old (E); F mouse, 8 mo old (F).
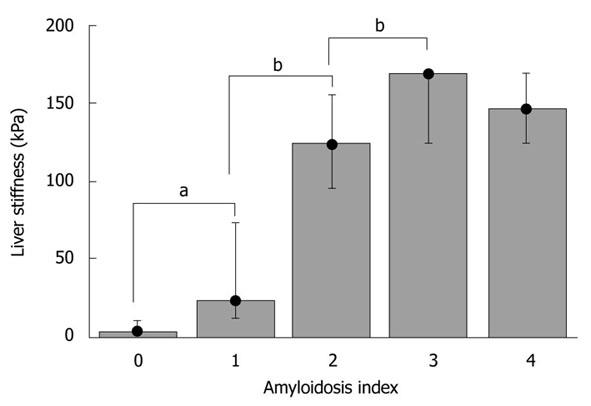
Figure 6 Bar plot showing median liver stiffness as a function of amyloidosis severity.
Liver stiffness is expressed in kPa, and amyloidosis severity is given according to the scoring system described in Materials and Methods. Whiskers indicate the extent of the data. The difference between index 0, 1, 2, and 3 is significant (aP < 0.005 and bP < 0.01; Mann-Whitney).
- Citation: Bastard C, Bosisio MR, Chabert M, Kalopissis AD, Mahrouf-Yorgov M, Gilgenkrantz H, Mueller S, Sandrin L. Transient micro-elastography: A novel non-invasive approach to measure liver stiffness in mice. World J Gastroenterol 2011; 17(8): 968-975
- URL: https://www.wjgnet.com/1007-9327/full/v17/i8/968.htm
- DOI: https://dx.doi.org/10.3748/wjg.v17.i8.968


