Copyright
©2011 Baishideng Publishing Group Co.
World J Gastroenterol. Feb 7, 2011; 17(5): 618-624
Published online Feb 7, 2011. doi: 10.3748/wjg.v17.i5.618
Published online Feb 7, 2011. doi: 10.3748/wjg.v17.i5.618
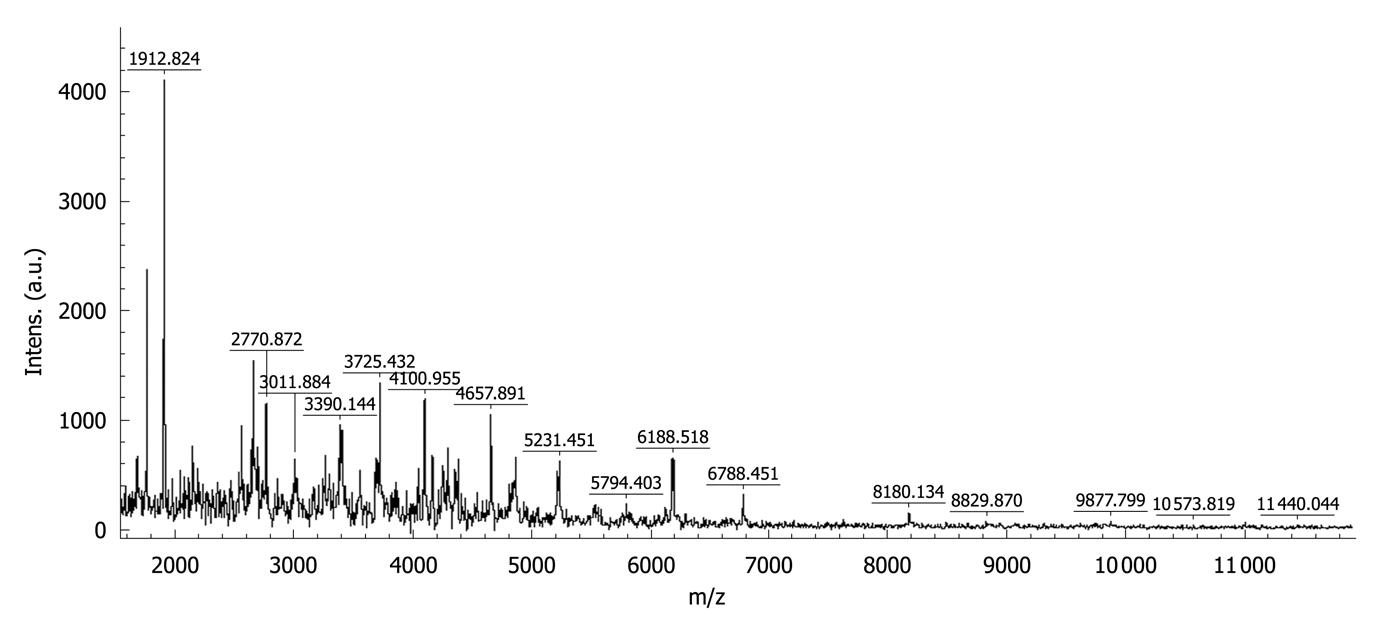
Figure 1 The mass spectrum of peptides in urine ranging between 1000 and 10 000 Da.
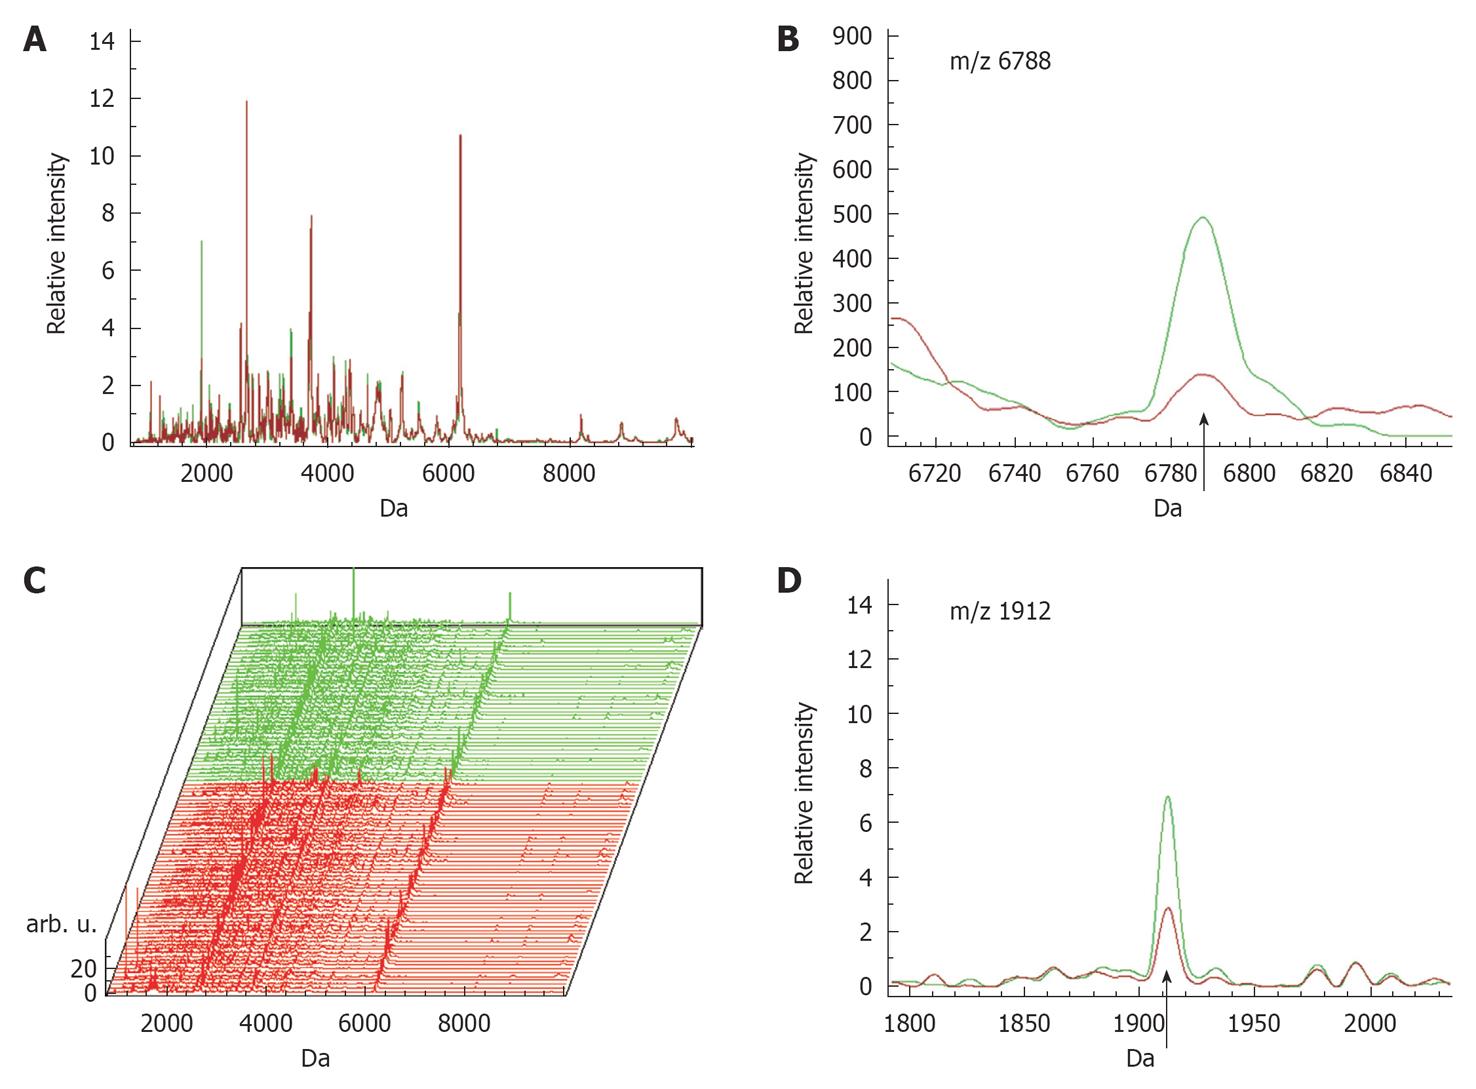
Figure 2 Differentially expressed low-mass peptides in human urine.
A: The average intensities of matrix-assisted laser desorption/ionization time-of-flight peaks for the healthy group (red line), and the H. pylori-infected group (green line); B, D: The enlarged picture m/z 6788 and m/z 1912, respectively, the healthy group (red line) and the H. pylori-infected group (green line); C: The complete spectra from both the healthy group (red line) and the H. pylori-infected group (green line).
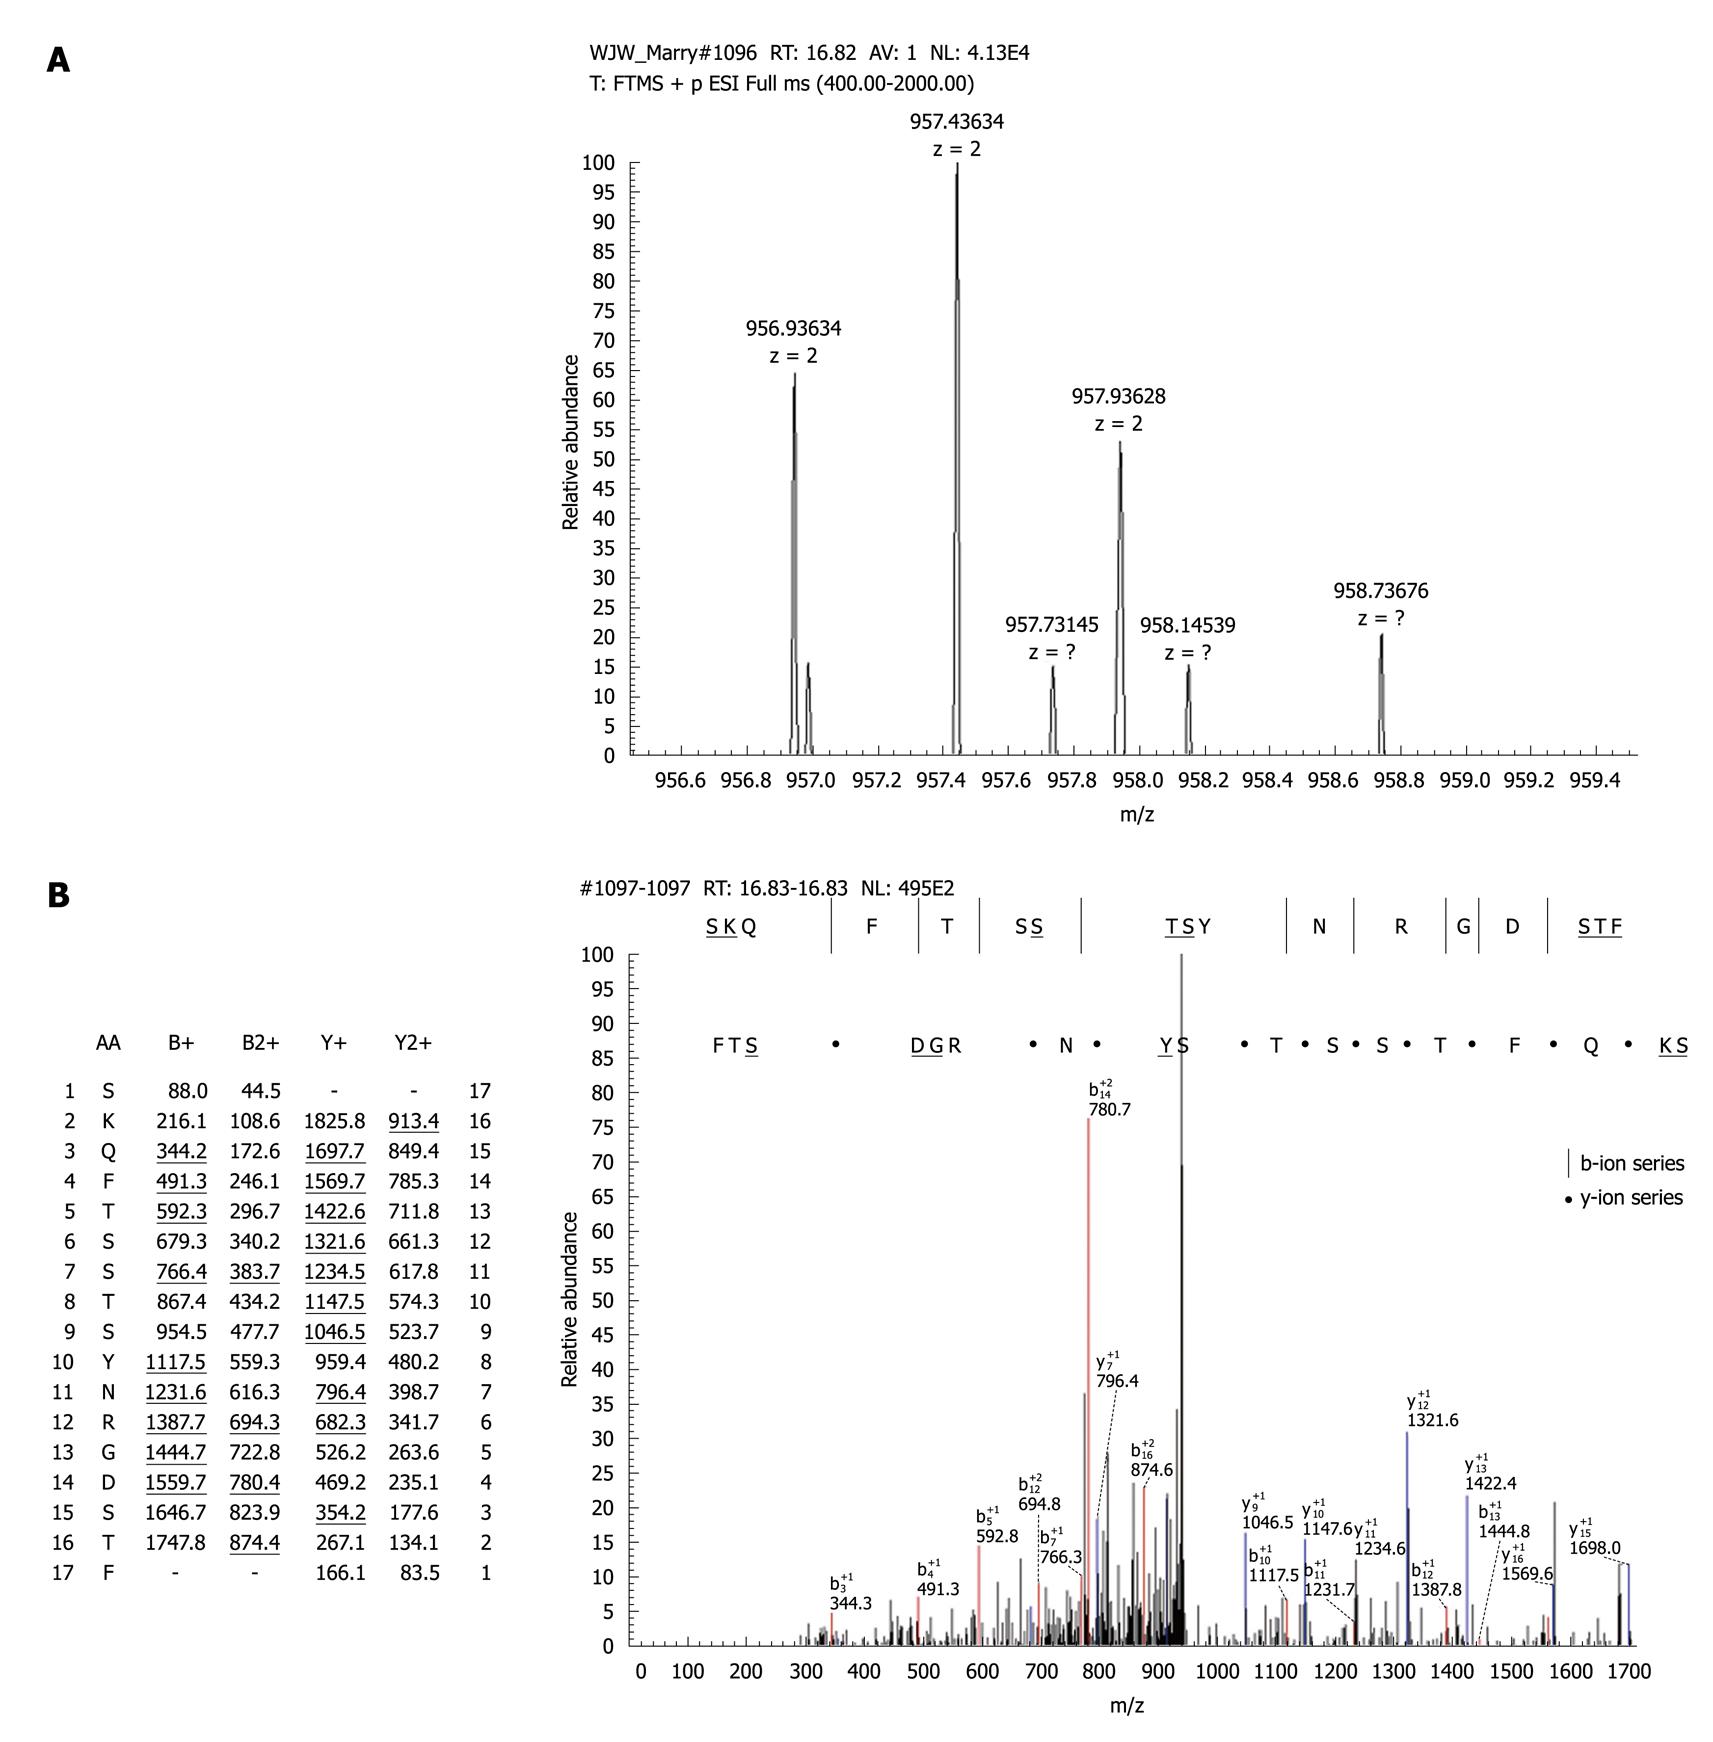
Figure 3 Protein identified by mass spectrometry/mass spectrometry.
A: The enlarged picture of m/z 1912 (two charges 957.4); B: The b and y ions spectra used to identify the m/z 1912 as the fragment SKQFTSSTSYNRGDSTF. The underlined amino acids represent b or y ions of amino acids that cannot be found in the spectra. The underlined values represent the peaks where amino acids match with the b, y-ion peak.
-
Citation: Xiao D, Meng FL, He LH, Gu YX, Zhang JZ. Analysis of the urinary peptidome associated with
Helicobacter pylori infection. World J Gastroenterol 2011; 17(5): 618-624 - URL: https://www.wjgnet.com/1007-9327/full/v17/i5/618.htm
- DOI: https://dx.doi.org/10.3748/wjg.v17.i5.618


