Copyright
©2011 Baishideng Publishing Group Co.
World J Gastroenterol. Dec 28, 2011; 17(48): 5280-5288
Published online Dec 28, 2011. doi: 10.3748/wjg.v17.i48.5280
Published online Dec 28, 2011. doi: 10.3748/wjg.v17.i48.5280
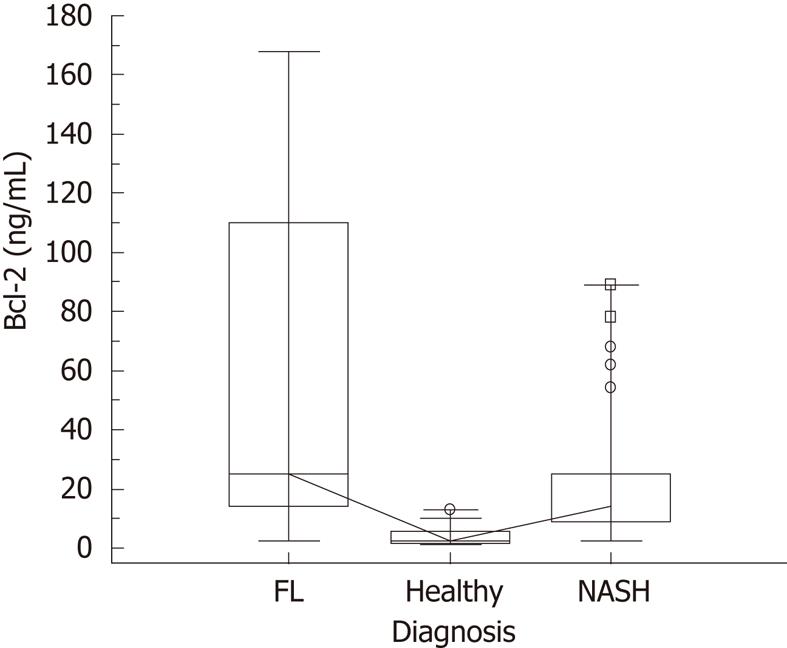
Figure 1 Serum concentrations of Bcl-2 in the whole population.
Kruskal-Wallis test (significance between healthy and fatty liver (FL), between healthy and non alcoholic steato hepatitis (NASH) and also between FL and NASH); the highest median value was found in the FL group, P≤ 0.001.
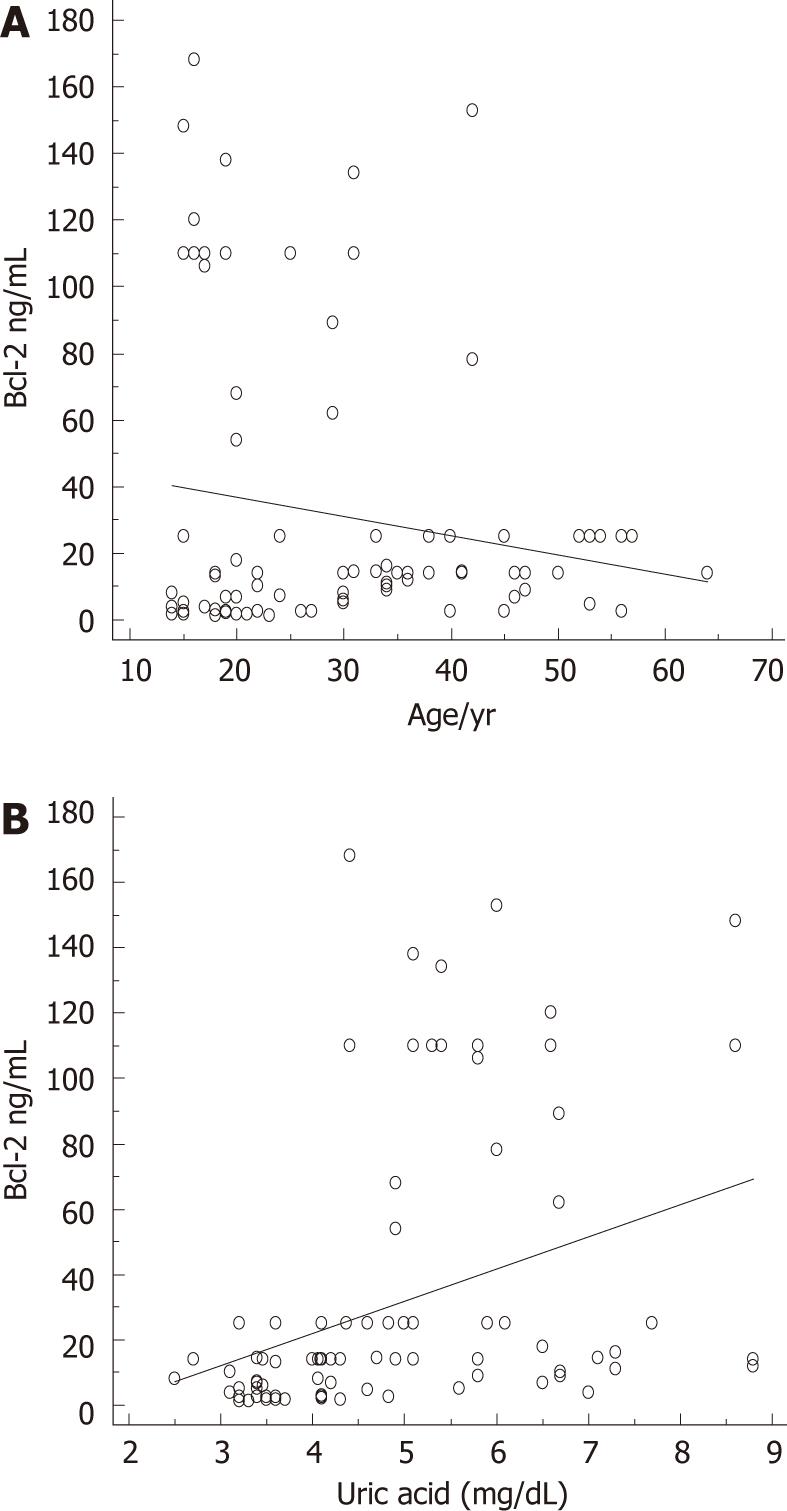
Figure 2 Prediction of Bcl-2 serum levels by age and uric acid.
A: Prediction of antiapoptotic Bcl-2 protein serum concentrations by age, β = -0.19, t = -2, P = 0.0527; B: Prediction of antiapoptotic Bcl-2 protein serum concentrations by uric acid, β = 0.35, t = 3.8, P = 0.0002.
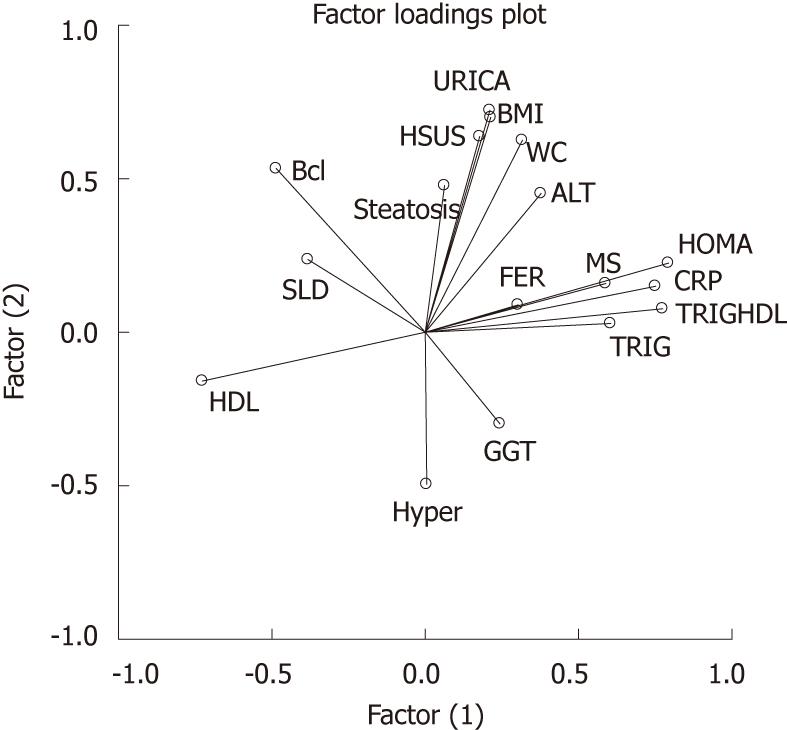
Figure 3 Variables clustered around factors.
Homeostatic metabolic assessment, C-reactive protein, triglycerides, triglycerides/high density lipoprotein ratio, ferritin and metabolic syndrome clustered around factor 1. HDL: High density lipoprotein. WC: Waist circumference; BMI: Body mass index; HOMA: Homeostatic metabolic assessment; HDL: High density lipoprotein; GGT: γ-glutamyl-transpeptidase; TRIG:Triglycerides; TRIGHDL: Triglycerides/high density lipoprotein; CRP: C-reactive protein; MS: Metabolic syndrome; FER: Ferritin; ALT: Alaninamino transferase; BMI: Body mass index; URICA: Uric acid; HSUS: Hepatic steatosis at ultrasound; SLD: Spleen longitudinal diameter.
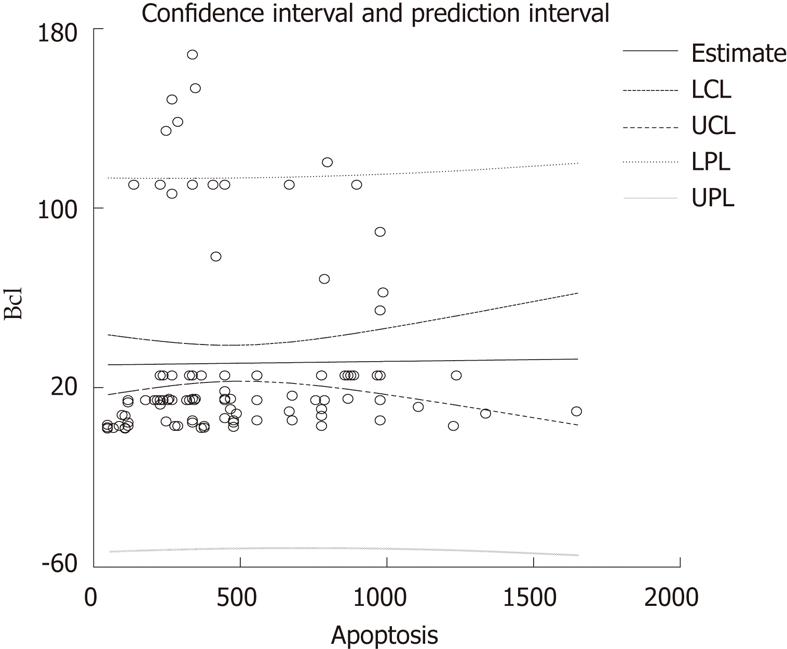
Figure 4 The concentration of serum Bcl-2 was not predicted by the number/mm2 of terminal deoxynucleotidyl transferase-mediated dUTP-biotin nick end labeling-positive cells.
LCL: Low confidence limit; UCL: Upper confidence limit; LPL: Low prediction limit; UPL: Upper prediction Limit.
- Citation: Tarantino G, Scopacasa F, Colao A, Capone D, Tarantino M, Grimaldi E, Savastano S. Serum Bcl-2 concentrations in overweight-obese subjects with nonalcoholic fatty liver disease. World J Gastroenterol 2011; 17(48): 5280-5288
- URL: https://www.wjgnet.com/1007-9327/full/v17/i48/5280.htm
- DOI: https://dx.doi.org/10.3748/wjg.v17.i48.5280


