Copyright
©2011 Baishideng Publishing Group Co.
World J Gastroenterol. Dec 7, 2011; 17(45): 4979-4986
Published online Dec 7, 2011. doi: 10.3748/wjg.v17.i45.4979
Published online Dec 7, 2011. doi: 10.3748/wjg.v17.i45.4979
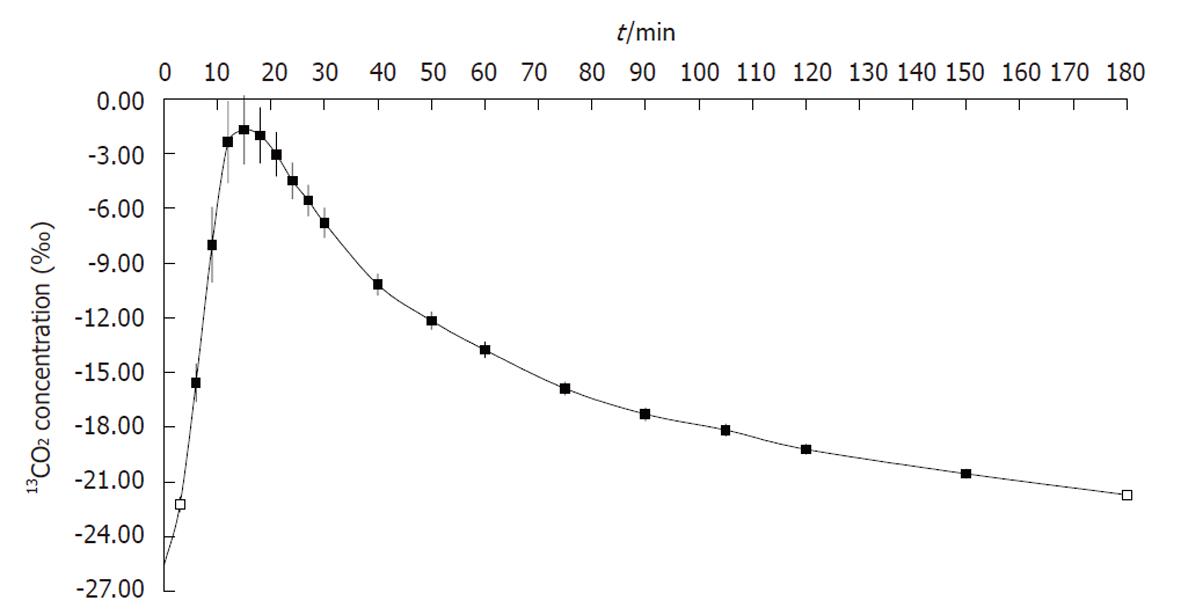
Figure 1 Time course of the 13CO2 content within the total pool of exhaled CO2 after peroral administration of 75 mg 13C-methacetin in 20 healthy volunteers who each underwent three breath tests on separate days.
Filled rectangles represent the time points at which the rise in 13CO2 concentration was statistically significantly different from the baseline measurement, open rectangles stand for values not statistically different from the baseline. The values shown are mean ± SE.
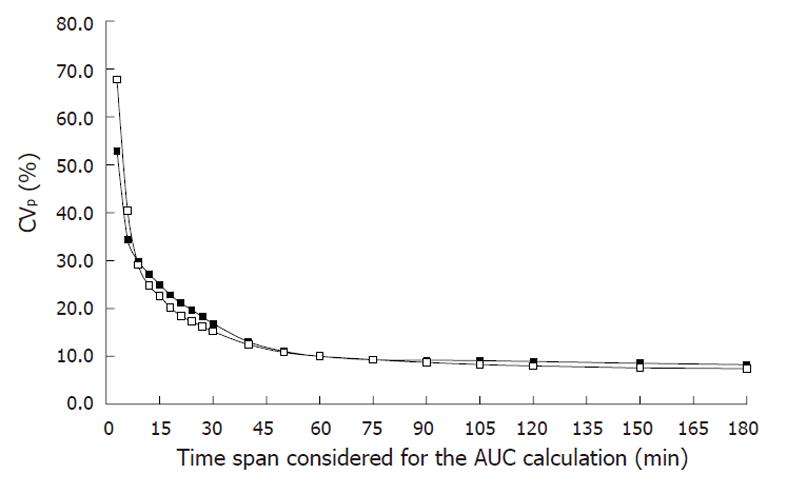
Figure 2 Relationship of the reproducibility of the cumulative 13C recovery, expressed in terms of the coefficient of variation for paired examinations (CVp), on the time span taken for the calculation of the area under the curve.
The short-term reproducibility (open rectangles) assessment involved performance of 20 pairs of 13C-methacetin breath tests separated by a median 2-d break, whereas 20 pairs of examinations accomplished at a median interval of 18 d were considered for the evaluation of the medium-term reproducibility (filled rectangles). AUC: Area under the curve.
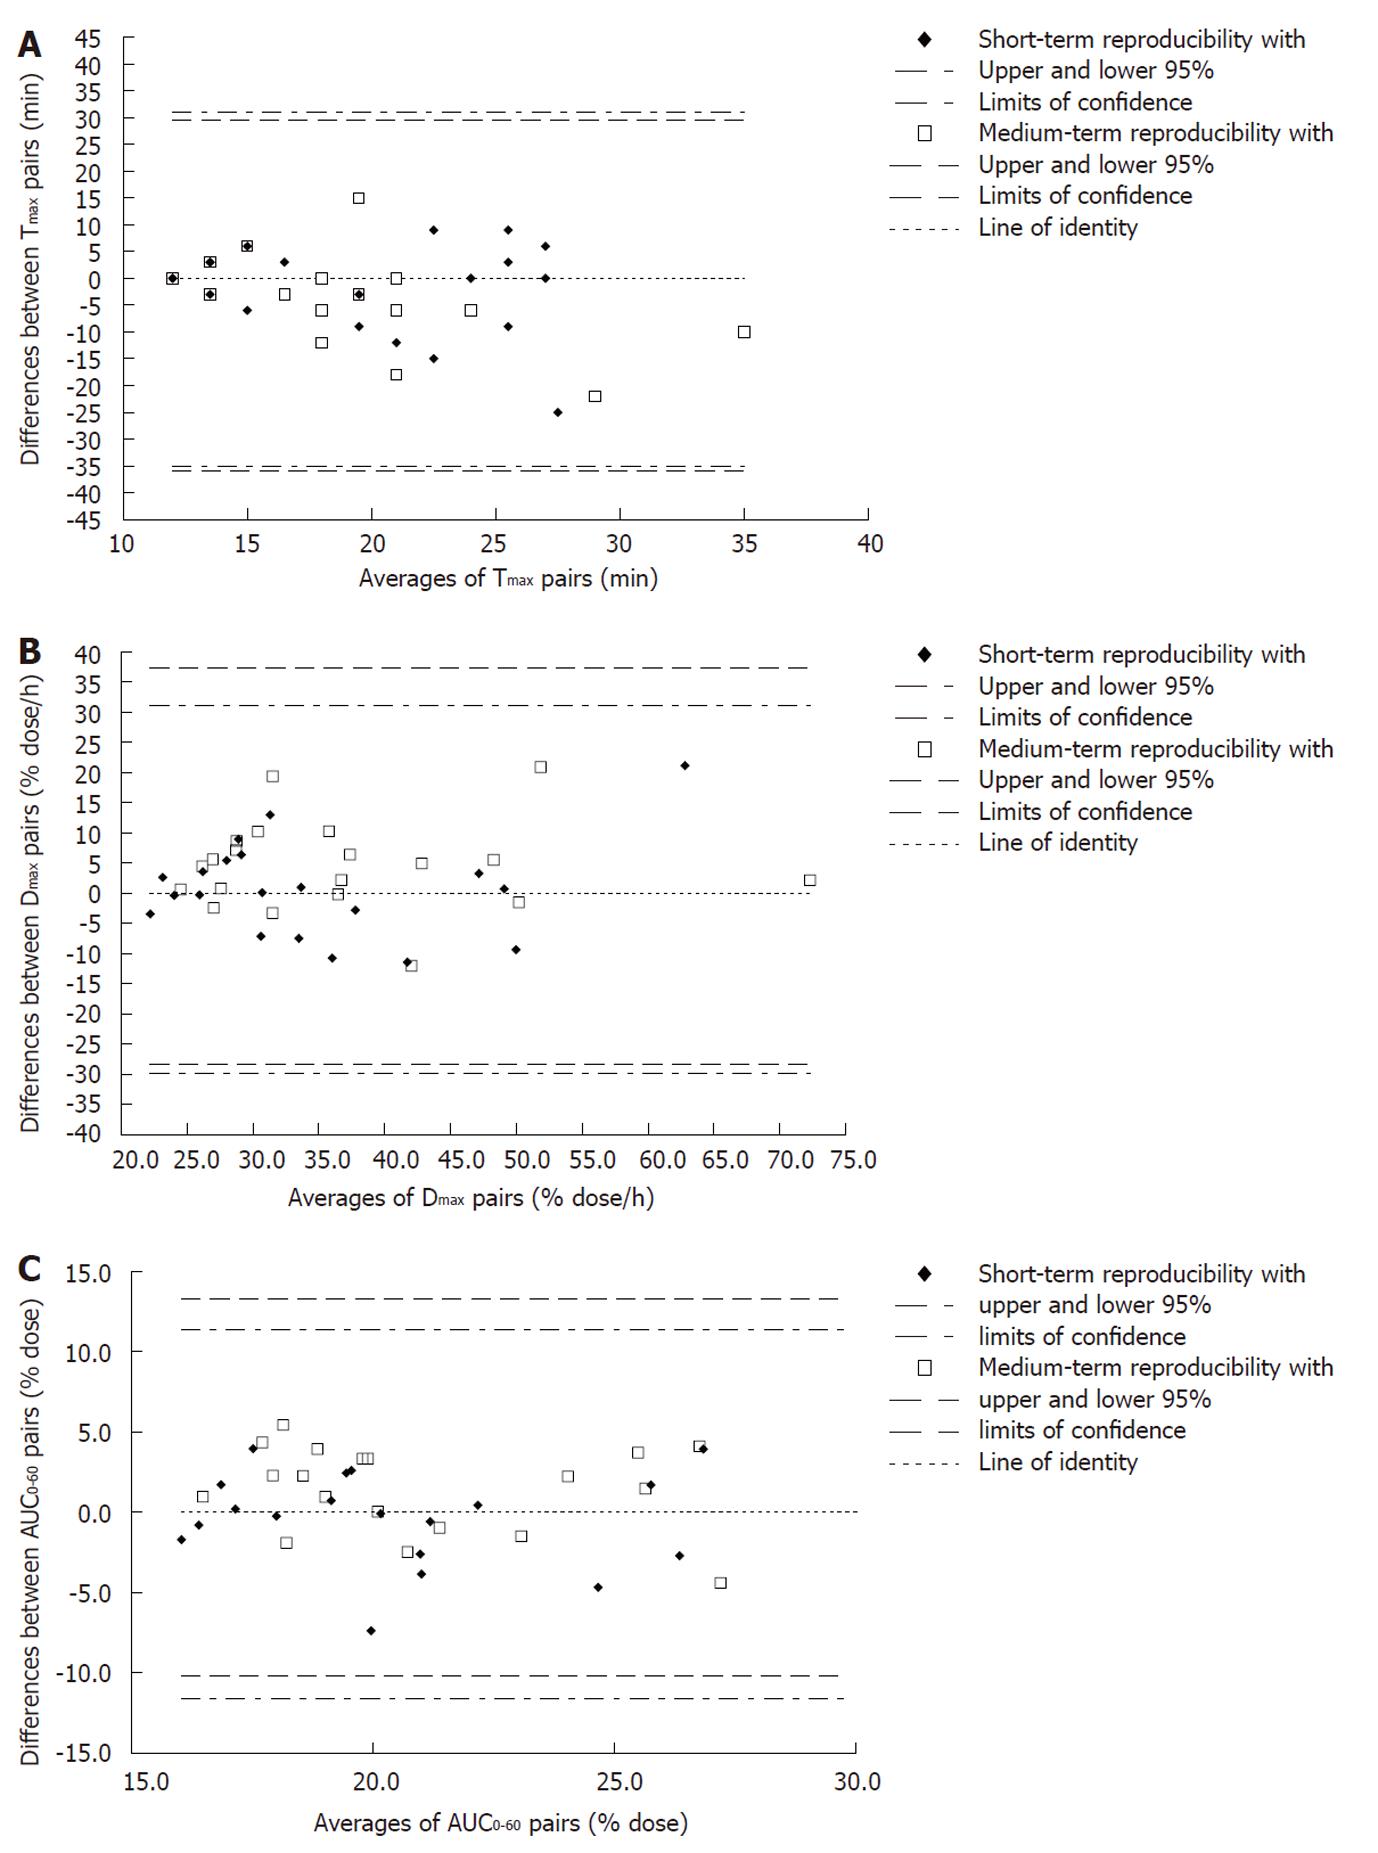
Figure 3 Bland and Altman statistics (plot of differences between pairs vs their means) of the short- (filled diamonds) and medium-term (open rectangles) reproducibility of the 13C-methacetin breath test.
Tmax: Time to reach the maximum momentary 13C elimination (panel A); Dmax: Maximum momentary 13C elimination (panel B); AUC0-60: 60-min cumulative 13C elimination in expiratory air (panel C). On each panel the respective borders of the 95% confidence intervals are plotted.
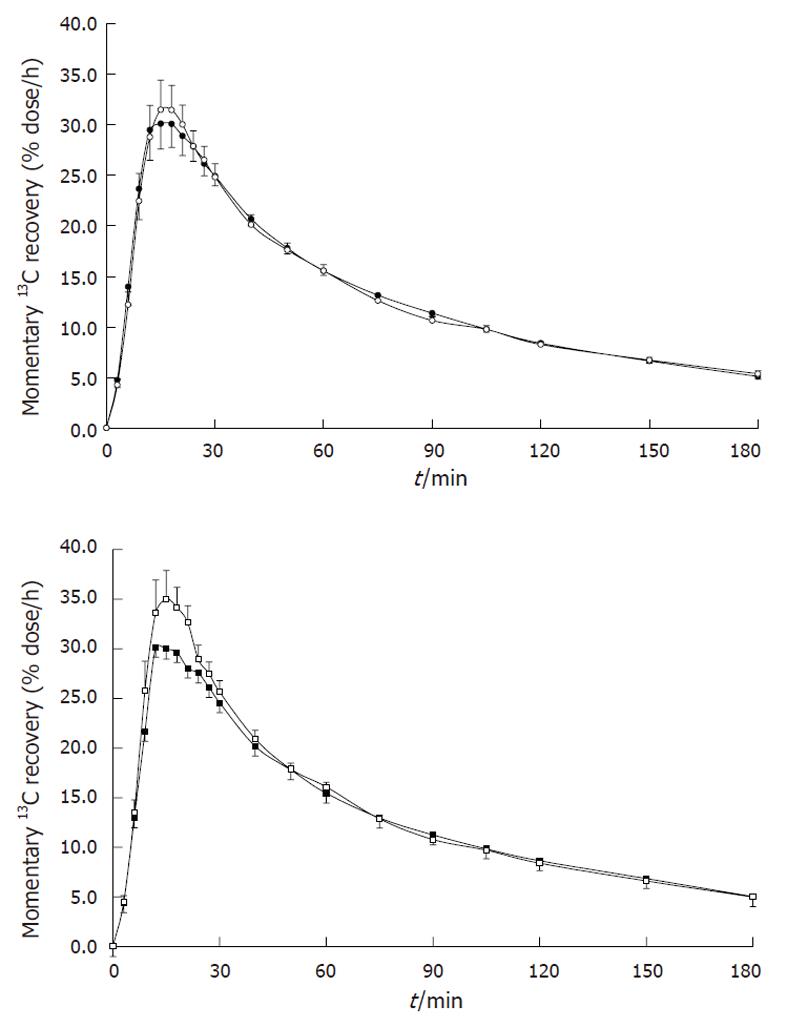
Figure 4 Corresponding curves of the momentary 13C recovery in breath air after peroral administration of 75 mg 13C-methacetin in 20 healthy volunteers if two examinations were taken at a median of 2 d apart (panel A) or if the examinations were separated by a median 18 d gap (panel B).
Open symbols, the first administration, filled symbols, the second administration, the values shown are mean ± SE. See the text for the results of the statistical comparison of the matching Dmax and AUC0-60 values.
- Citation: Kasicka-Jonderko A, Nita A, Jonderko K, Kamińska M, Błońska-Fajfrowska B. 13C-methacetin breath test reproducibility study reveals persistent CYP1A2 stimulation on repeat examinations. World J Gastroenterol 2011; 17(45): 4979-4986
- URL: https://www.wjgnet.com/1007-9327/full/v17/i45/4979.htm
- DOI: https://dx.doi.org/10.3748/wjg.v17.i45.4979


