Copyright
©2011 Baishideng Publishing Group Co.
World J Gastroenterol. Oct 28, 2011; 17(40): 4456-4460
Published online Oct 28, 2011. doi: 10.3748/wjg.v17.i40.4456
Published online Oct 28, 2011. doi: 10.3748/wjg.v17.i40.4456
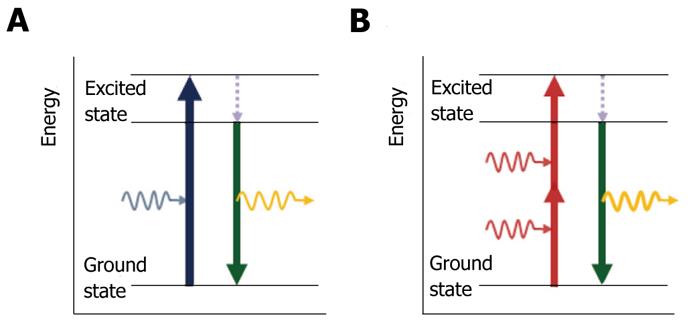
Figure 1 Multiphoton excitation.
A: Single-photon excitation. Individual photons of high-energy blue light (wavelength, λ = 480 nm) excite fluorophores in the sample. After an electron in the fluorophore is transferred to the excited state (blue arrow), it loses energy rapidly owing to non-radiative relaxation (dashed arrow). Subsequently, fluorescence emission (yellow curved arrow) occurs at a longer wavelength than the excitation light as the electron falls back to the ground state (green arrow); B: Two-photon excitation. Two infrared photons (λ = 780 nm) are absorbed simultaneously (red arrows) to excite the fluorophore and light is emitted in the same manner as for single-photon excitation (green arrow) with emission of fluorescein.
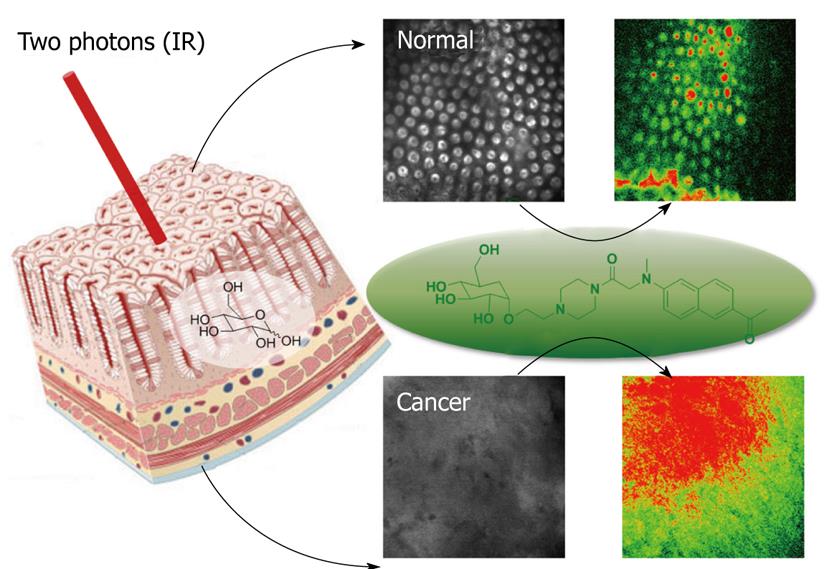
Figure 2 Images of normal tissue (above) and cancer tissue (below) treated with AG2.
Normal tissues were incubated in artificial cerebrospinal fluid (ACSF) for 4 h, and cancer tissues were incubated in ACSF for 4 h, after which AG2 uptake was monitored. Right-side images are bright-field images, left-side images are pseudocolored two-photon microscopy (TPM) images obtained after incubation with AG2 for 4 h. The TPM images were obtained at a depth of 100 μm by collecting the two-photon excited fluorescence spectra in the range of 520-620 nm on excitation with fs pulses at 780 nm. IR: Infrared.
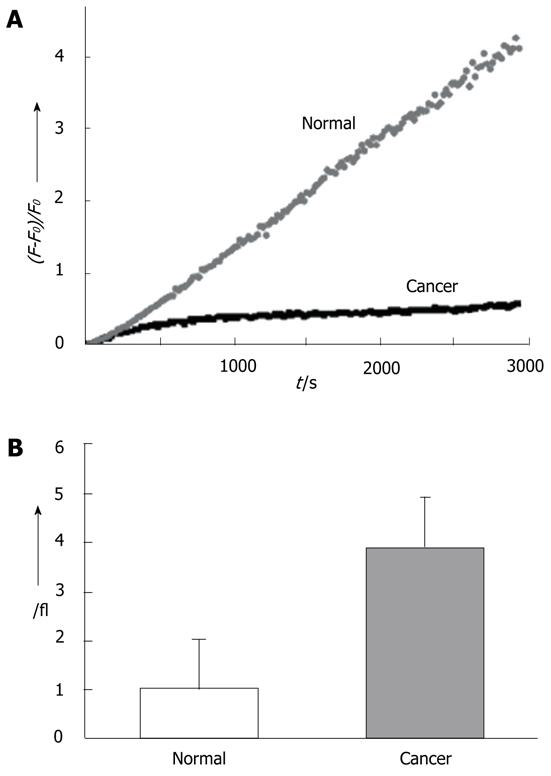
Figure 3 AG2 uptake in normal and cancerous tissues.
A: Time course of AG2 uptake by normal tissue and cancer tissue at 100 μm depth as a function of time; B: Relative AG2 uptake by normal tissue and cancer tissue for 4000 s. The columns indicate the sum of the two-photon excited fluorescence intensities measured by photomultiplier tube at depths of 75, 100, 125 and 150 μm from the tissue surface, relative to that of normal tissue. The data are the average of three independent experiments.
- Citation: Cho HJ, Chun HJ, Kim ES, Cho BR. Multiphoton microscopy: An introduction to gastroenterologists. World J Gastroenterol 2011; 17(40): 4456-4460
- URL: https://www.wjgnet.com/1007-9327/full/v17/i40/4456.htm
- DOI: https://dx.doi.org/10.3748/wjg.v17.i40.4456


