Copyright
©2011 Baishideng Publishing Group Co.
World J Gastroenterol. Jan 28, 2011; 17(4): 506-513
Published online Jan 28, 2011. doi: 10.3748/wjg.v17.i4.506
Published online Jan 28, 2011. doi: 10.3748/wjg.v17.i4.506
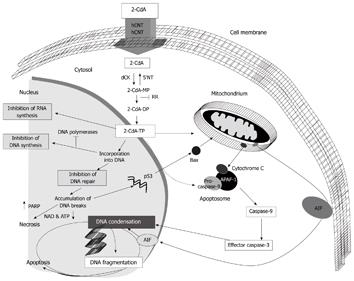
Figure 1 Schematic representation of intracellular pathways involved in 2-CdA cytotoxicity.
(Adapted with permission from Borak, 2006). 2-CdA-MP: Cladribine monophosphate; 2-CdA-DP: Cladribine diphosphate; 2-CdA-TP: Cladribine triphosphate; dCK: Deoxycytidine kinase; 5’-NT: 5’-nucleotidase; hENT: Human equilibrative nucleoside transporter; hCNT: Human concentrative nucleoside transporter; AIF: Apoptosis inducing factor; APAF-1: Apoptotic protease activating factor; PARP: Poly (ADP-ribose) polymerase.
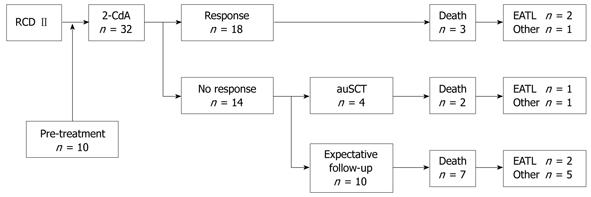
Figure 2 Flowchart of the response to cladribine treatment.
RCD: Refractory celiac disease; 2-CdA: 2-chlorodeoxyadenosine; auSCT: autologous hematopoietic stem cell transplantation; EATL: Enteropathy associated T-cell lymphoma.
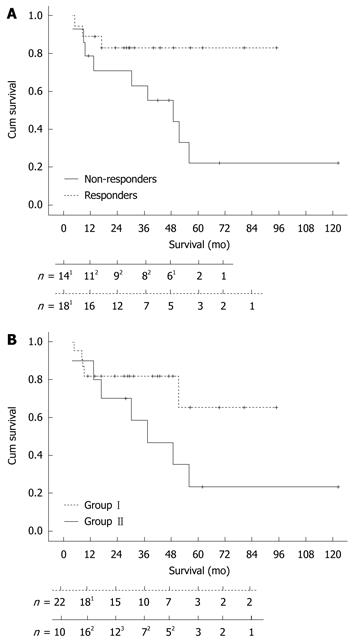
Figure 3 Kaplan-Meier survival curves.
A: Survival rate of responders and non-responders to cladribine treatment (Log Rank: P = 0.037). 13 patients died in the 1st and 5th year; 21 patient died in the 2nd, 3rd and 4th year of follow-up; B: Survival rate of the pre-treatment (I) and the upfront 2-chlorodeoxyadenosine (II) group (Log Rank: P = 0.23). 14 patients died in the 1st year; 21 patient died in the 1st, 3rd and 4th year; 32 patients died in the 2nd year of follow-up.
- Citation: Tack GJ, Verbeek WH, Al-Toma A, Kuik DJ, Schreurs MW, Visser O, Mulder CJ. Evaluation of Cladribine treatment in refractory celiac disease type II. World J Gastroenterol 2011; 17(4): 506-513
- URL: https://www.wjgnet.com/1007-9327/full/v17/i4/506.htm
- DOI: https://dx.doi.org/10.3748/wjg.v17.i4.506


