Copyright
©2011 Baishideng Publishing Group Co.
World J Gastroenterol. Oct 7, 2011; 17(37): 4184-4190
Published online Oct 7, 2011. doi: 10.3748/wjg.v17.i37.4184
Published online Oct 7, 2011. doi: 10.3748/wjg.v17.i37.4184
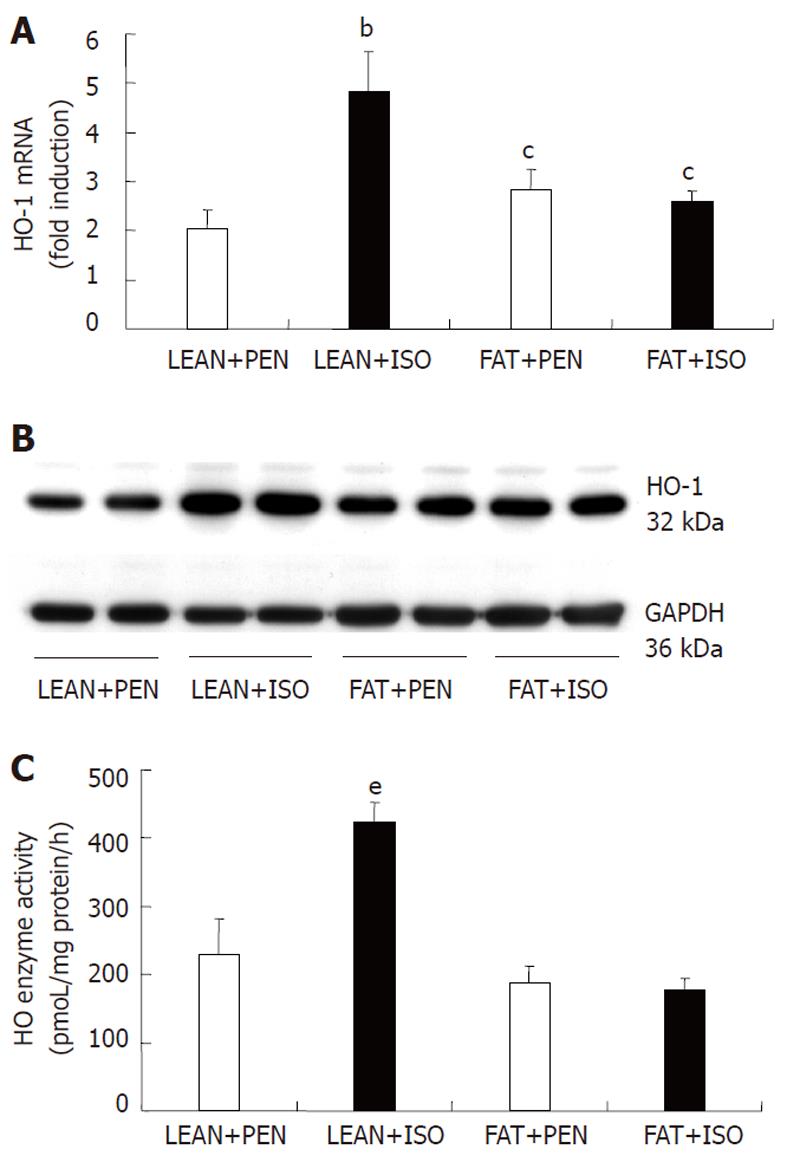
Figure 1 Hepatic heme oxygenase-1 gene expression and heme oxygenase enzyme activity in lean and obese Zucker rats after treatment with pentobarbital or isoflurane.
A: Reverse transcriptase-polymerase chain reaction was performed for determination of HO-1 mRNA expression. Data are presented as mean ± SE of the mean for n = 5 per group. bP < 0.01 vs all other groups; cP < 0.05 vs LEAN+PEN; B: Western blotting analysis for determination of HO-1 protein expression in two representative animals from each group; C: Measurement of HO enzyme activity. Data are presented as mean ± SE for n = 5 per group. eP < 0.001 vs all other groups. HO-1: Heme oxygenase-1; PEN: Pentobarbital; ISO: Isoflurane. LEAN: Lean Zucker rats; FAT: Obese Zucker rats; GAPDH: Glyceraldehyde-3-phosphate dehydrogenase.
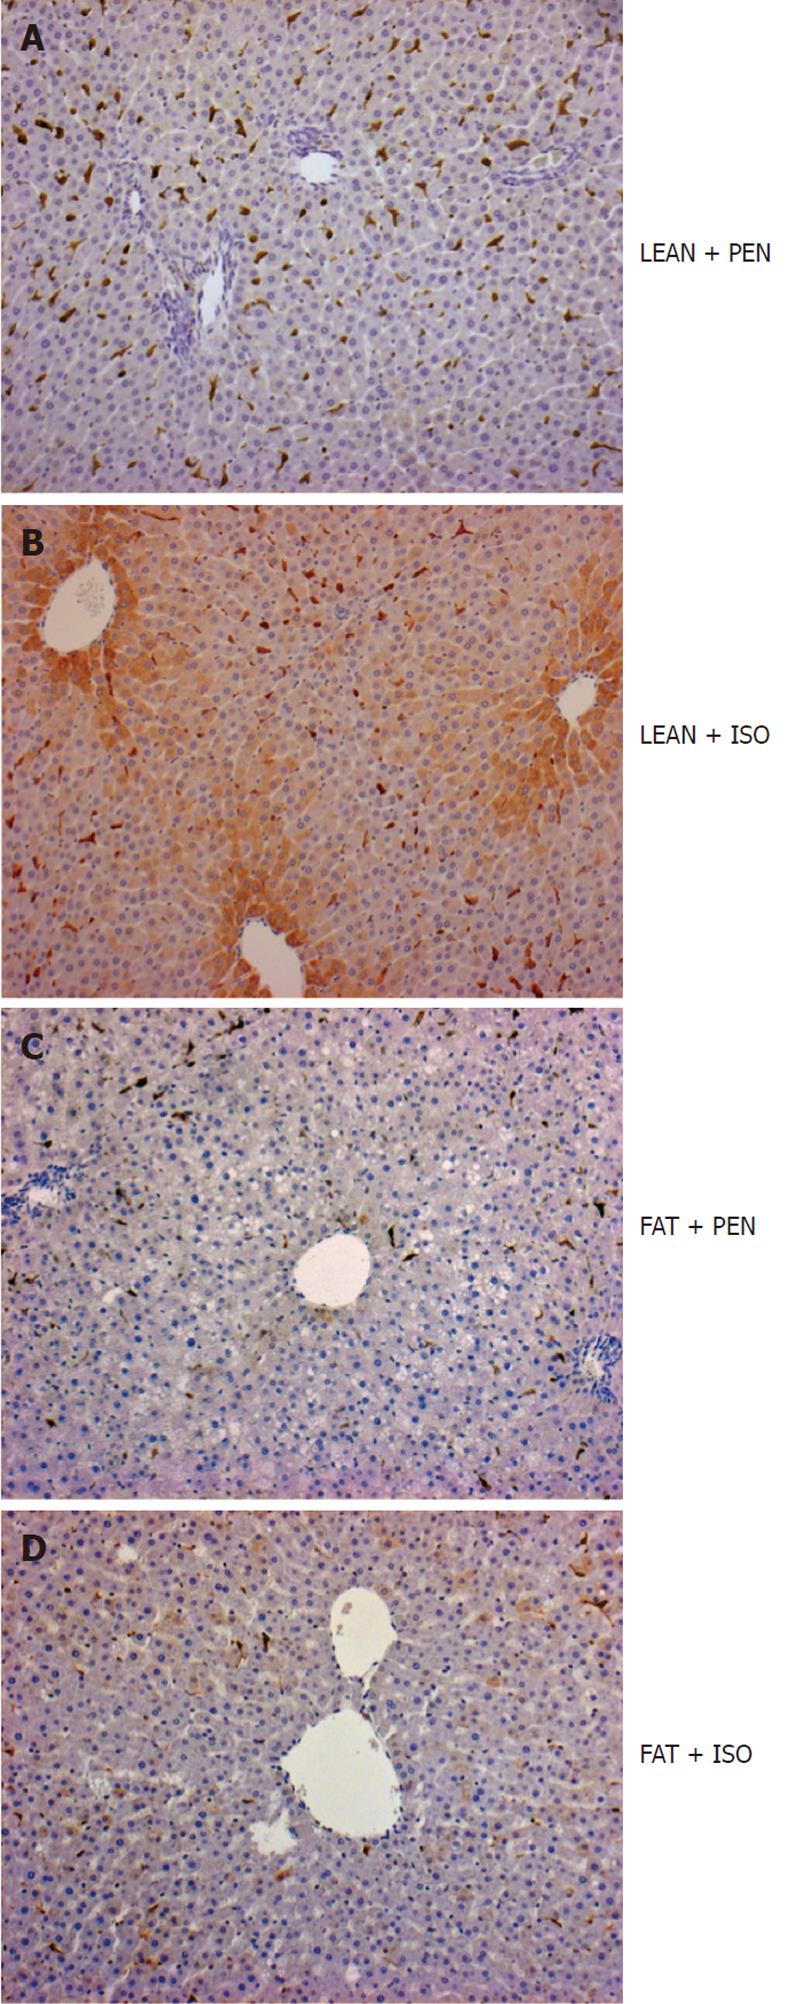
Figure 2 Heme oxygenase-1 protein expression pattern in liver sections from lean and obese Zucker rats after treatment with pentobarbital or isoflurane.
A: Heme oxygenase-1 (HO-1) protein was restricted to spindle-shaped sinusoidal lining cells in pentobarbital treated animals; B: Isoflurane (ISO) administration led to markedly upregulated HO-1 protein expression in hepatocytes of the perivenular area; C and D: No detectable induction of HO-1 protein in hepatocytes of obese animals was detected after ISO treatment. PEN: Pentobarbital; ISO: Isoflurane; LEAN: Lean Zucker rats; FAT: Obese Zucker rats.
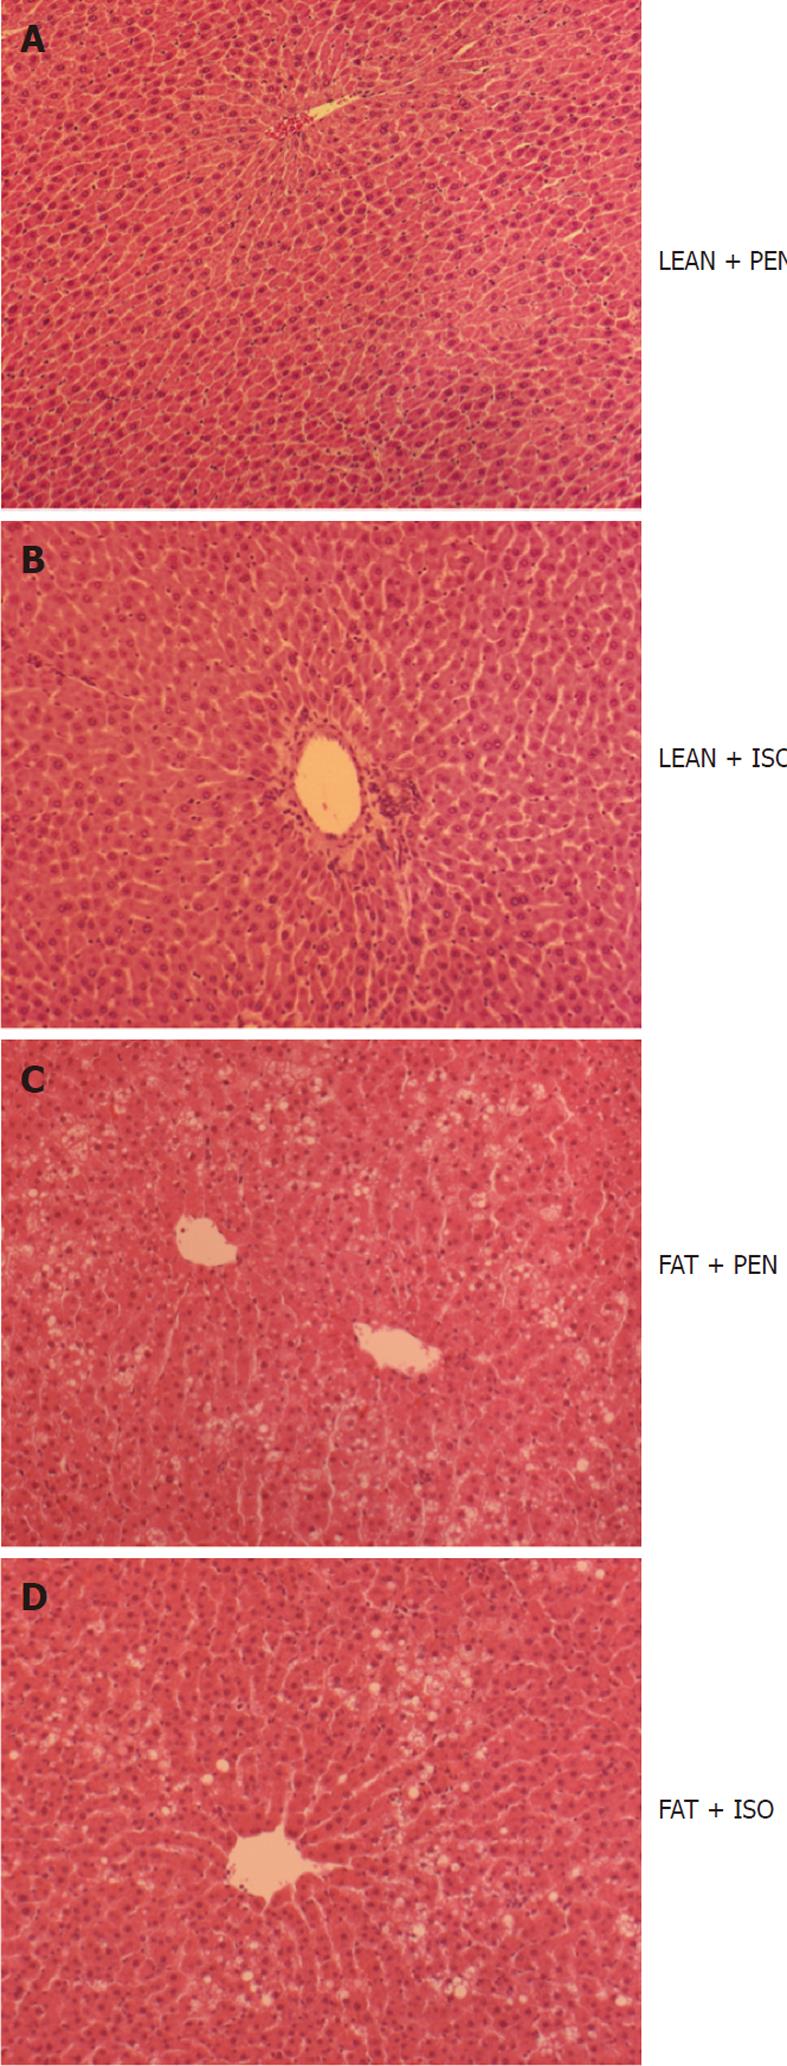
Figure 3 Hematoxylin and eosin staining of liver sections.
To assess the degree of hepatic steatosis, hematoxylin-eosinstaining was performed. A, B: No lipid droplets were detected in lean Zucker rats; C, D: In obese Zucker rats numerous intracellular lipid vacuoles were observed within the liver tissue. PEN: Pentobarbital; ISO: Isoflurane; LEAN: Lean Zucker rats; FAT: Obese Zucker rats..
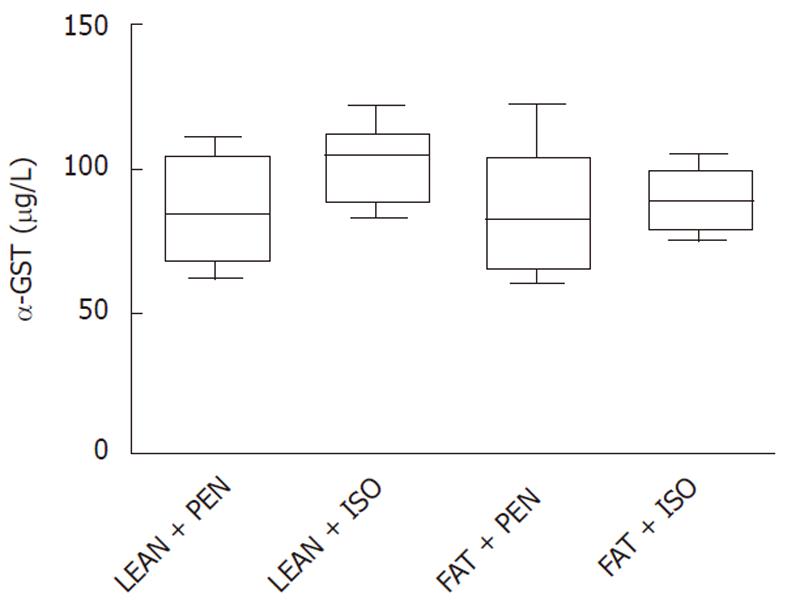
Figure 4 Determination of serum levels of α-glutathione s-transferase.
There were no significant differences in α-glutathione s-transferase serum levels between the different groups. Data are presented as median (box: 25th and 75th percentiles; error bars: 5th and 95th percentiles) for n = 5 animals per group. PEN: Pentobarbital; ISO: Isoflurane; LEAN: Lean Zucker rats; FAT: Obese Zucker rats.
- Citation: Stoll P, Schwer CI, Goebel U, Buerkle H, Hoetzel A, Schmidt R. Hepatic steatosis prevents heme oxygenase-1 induction by isoflurane in the rat liver. World J Gastroenterol 2011; 17(37): 4184-4190
- URL: https://www.wjgnet.com/1007-9327/full/v17/i37/4184.htm
- DOI: https://dx.doi.org/10.3748/wjg.v17.i37.4184


