Copyright
©2011 Baishideng Publishing Group Co.
World J Gastroenterol. Sep 14, 2011; 17(34): 3916-3921
Published online Sep 14, 2011. doi: 10.3748/wjg.v17.i34.3916
Published online Sep 14, 2011. doi: 10.3748/wjg.v17.i34.3916
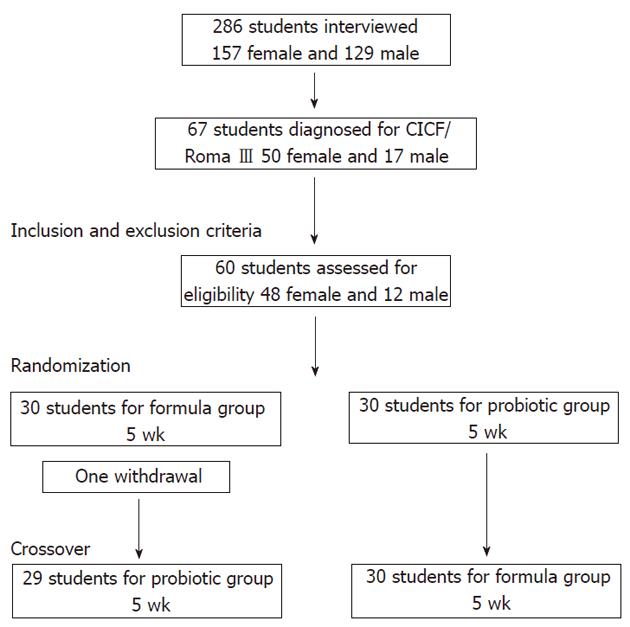
Figure 1 Participant flow diagram.
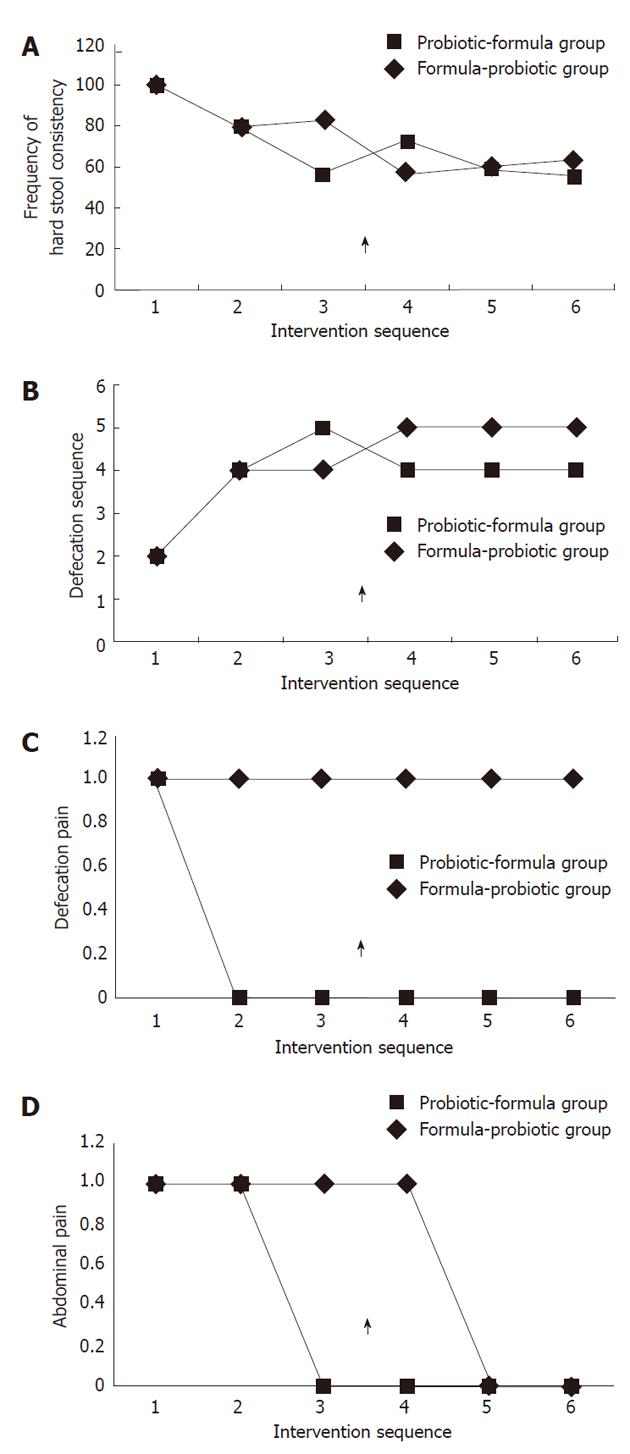
Figure 2 Evolution of hard stool consistency (Bristol scale < 4) (A), defecation frequency (B), defecation pain (C) and abdominal pain (D)during the intervention sequence.
1: A1; 2: A2; 3: A3; 4: B1; 5: B2; 6: B3. Arrow shows the moment of inversion in the intervention sequence.
-
Citation: Guerra PV, Lima LN, Souza TC, Mazochi V, Penna FJ, Silva AM, Nicoli JR, Guimarães EV. Pediatric functional constipation treatment with
Bifidobacterium -containing yogurt: A crossover, double-blind, controlled trial. World J Gastroenterol 2011; 17(34): 3916-3921 - URL: https://www.wjgnet.com/1007-9327/full/v17/i34/3916.htm
- DOI: https://dx.doi.org/10.3748/wjg.v17.i34.3916


