Copyright
©2011 Baishideng Publishing Group Co.
World J Gastroenterol. Sep 14, 2011; 17(34): 3899-3911
Published online Sep 14, 2011. doi: 10.3748/wjg.v17.i34.3899
Published online Sep 14, 2011. doi: 10.3748/wjg.v17.i34.3899
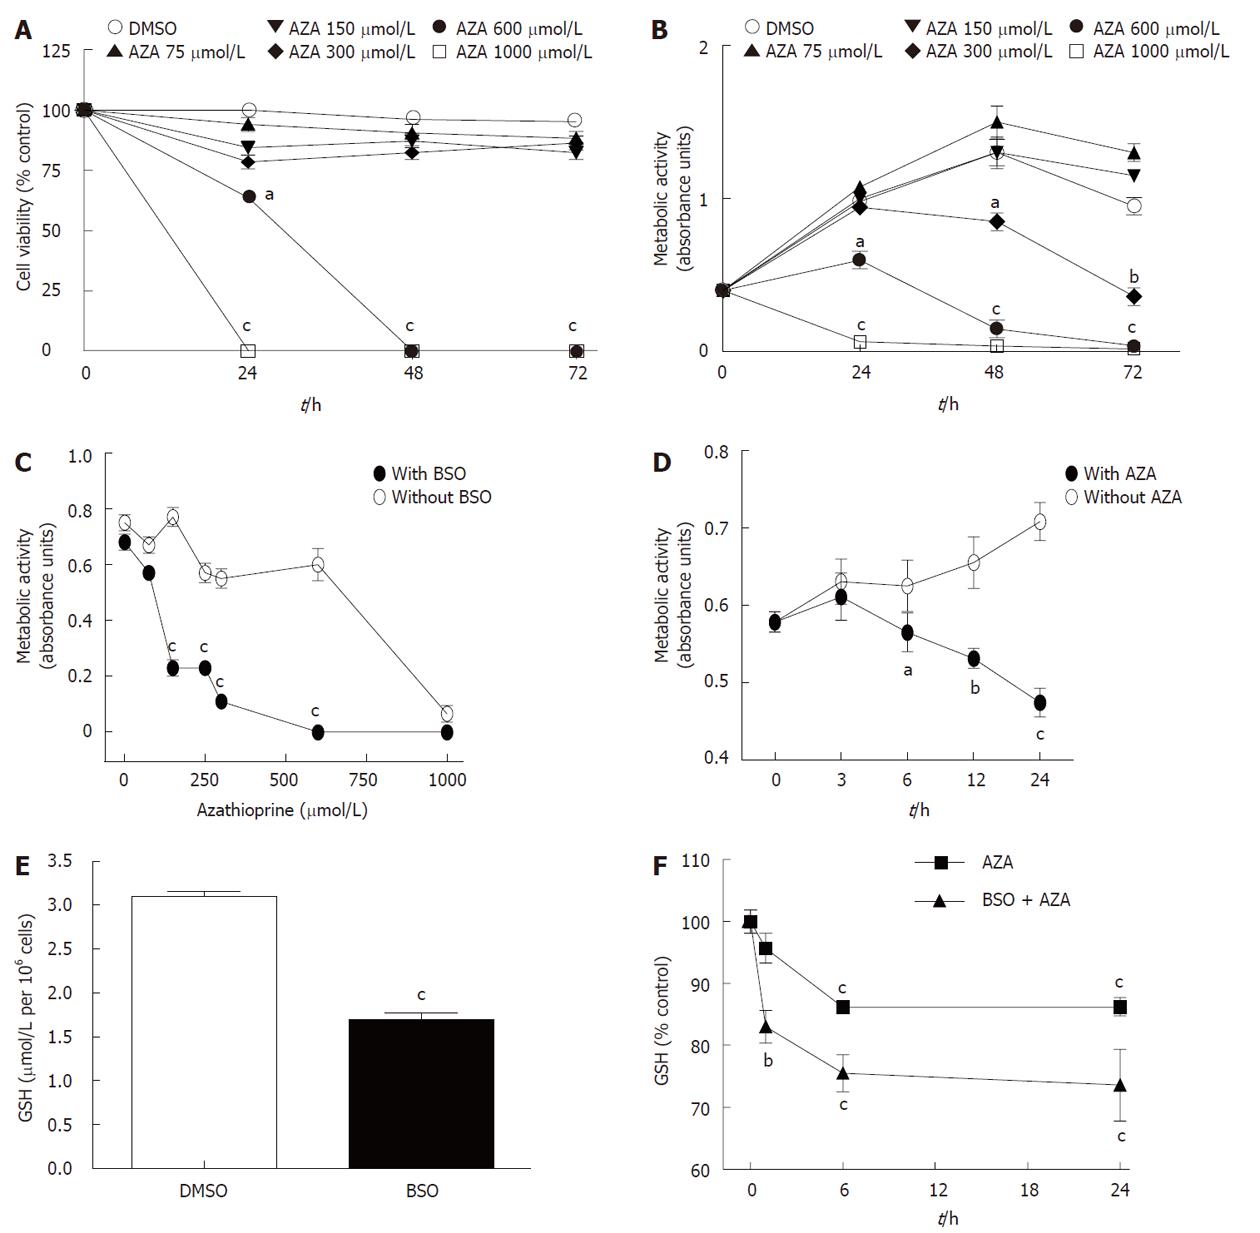
Figure 1 Effect of azathioprine treatment in HepG2 cells and sensitization of HepG2 cells by buthionine sulfoximine pretreatment.
A: Cell viability (by trypan blue exclusion assay); B: Metabolic activity (by MTT assay) of HepG2 cells treated at different times with dimethyl sulfoxide (DMSO) or azathioprine (AZA) at different concentrations; C: Metabolic activity of cultured HepG2 cells pretreated for 24 h without or with buthionine sulfoximine (BSO) (500 μmol/L) and then cotreated with AZA at different concentrations for 24 h, or D with AZA (100 μmol/L) at different times; E: Glutathione (GSH) content of HepG2 cells pretreated for 24 h with DMSO or BSO (500 μmol/L); F: GSH content of HepG2 cells pretreated for 24 h with DMSO or BSO (500 μmol/L) and then cotreated with AZA (300 μmol/L) for different times. The significant differences with respect to control were statistically analyzed by analysis of variance with the Bonferroni post hoc test. aP < 0.05; bP < 0.01; cP < 0.001.
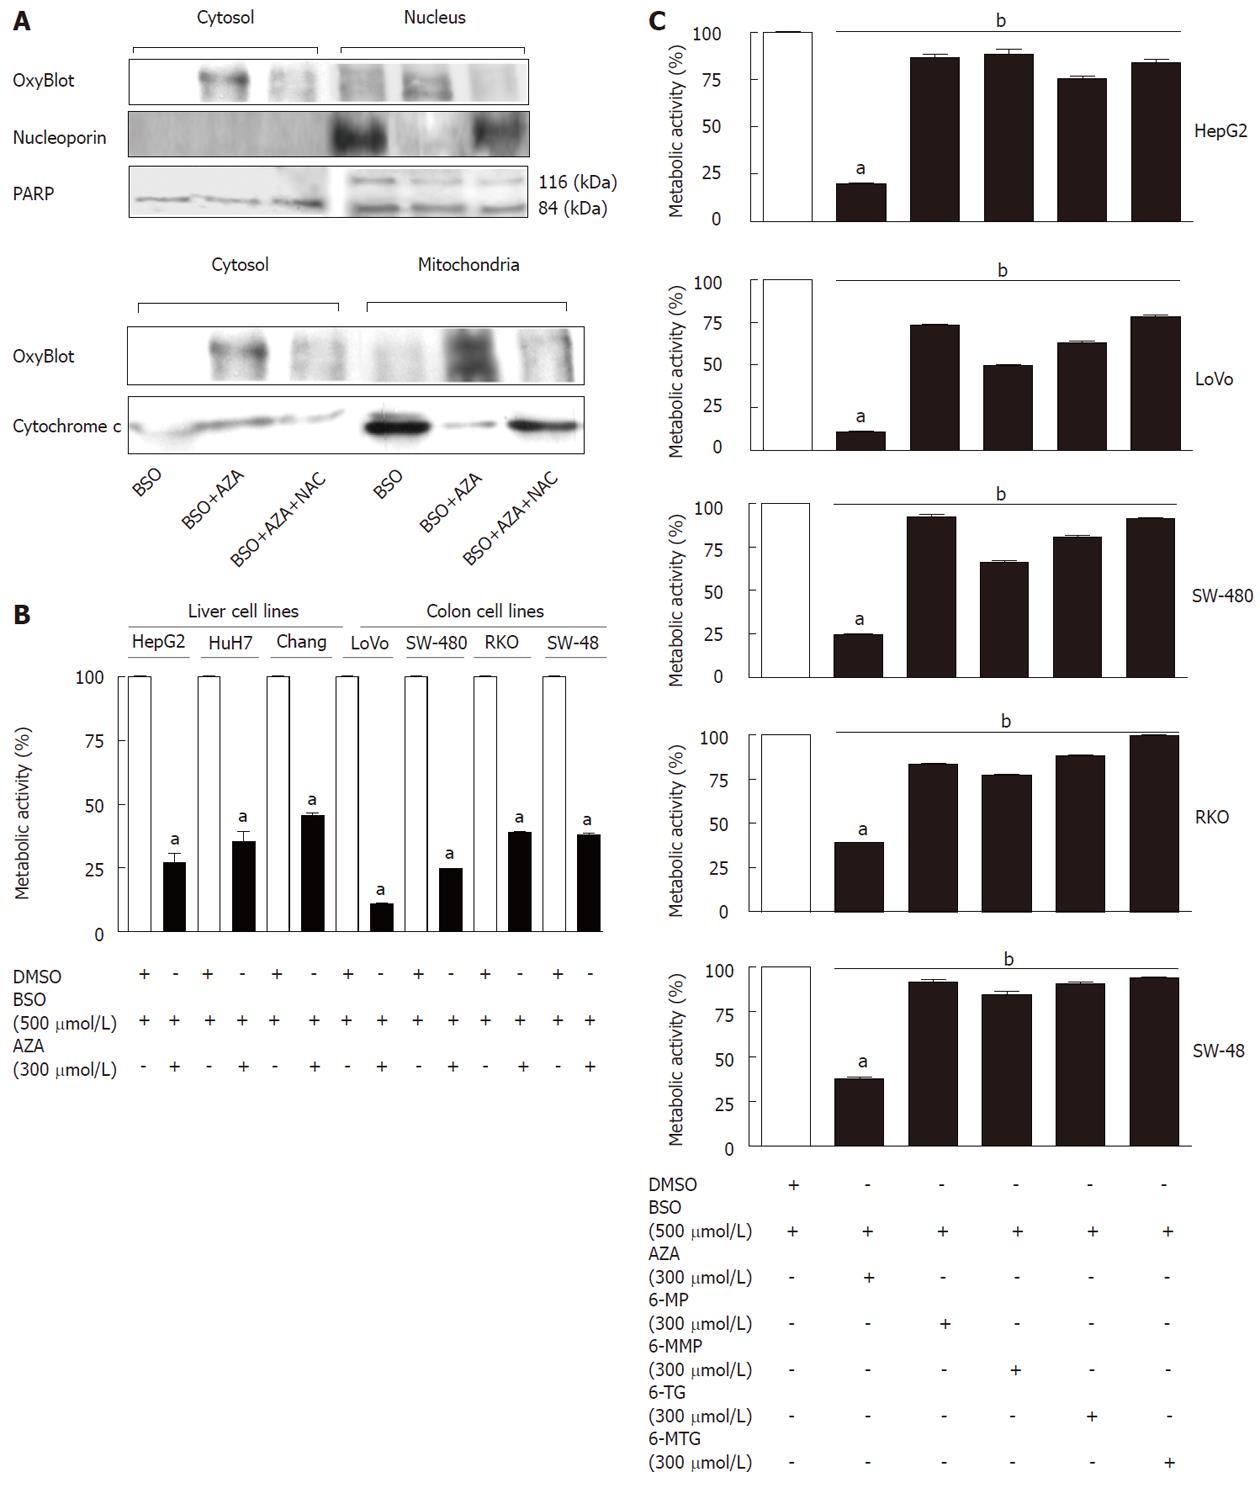
Figure 2 Effect of the treatment with thiopurines plus buthionine sulfoximine in cancerous cell lines.
A: Western blotting of several proteins from enriched fractions of cytosol, nucleus and mitochondria obtained from HepG2 cells pretreated with buthionine sulfoximine (BSO) (500 μmol/L, 24 h), or pretreated with BSO (500 μmol/L, 24 h) and then cotreated with azathioprine (AZA) (300 μmol/L) for 6 h with or without N-acetylcysteine (NAC) (1.5 mmol/L); B: Metabolic activity (by MTT assay) in different cancer cell lines from liver and colon pretreated with BSO (24 h) and then cotreated with dimethyl sulfoxide (DMSO) or with AZA for 12 h; C: Metabolic activity (by MTT assay) in different cell lines pretreated with BSO (24 h) and then cotreated with AZA or with different thiopurines for 12 h. Significant differences with respect to control (DMSO plus BSO) were statistically analyzed by analysis of variance with the Bonferroni post hoc test. aP < 0.001, BSO plus AZA vs control. bP < 0.001, BSO plus AZA vs BSO plus different thiopurines.
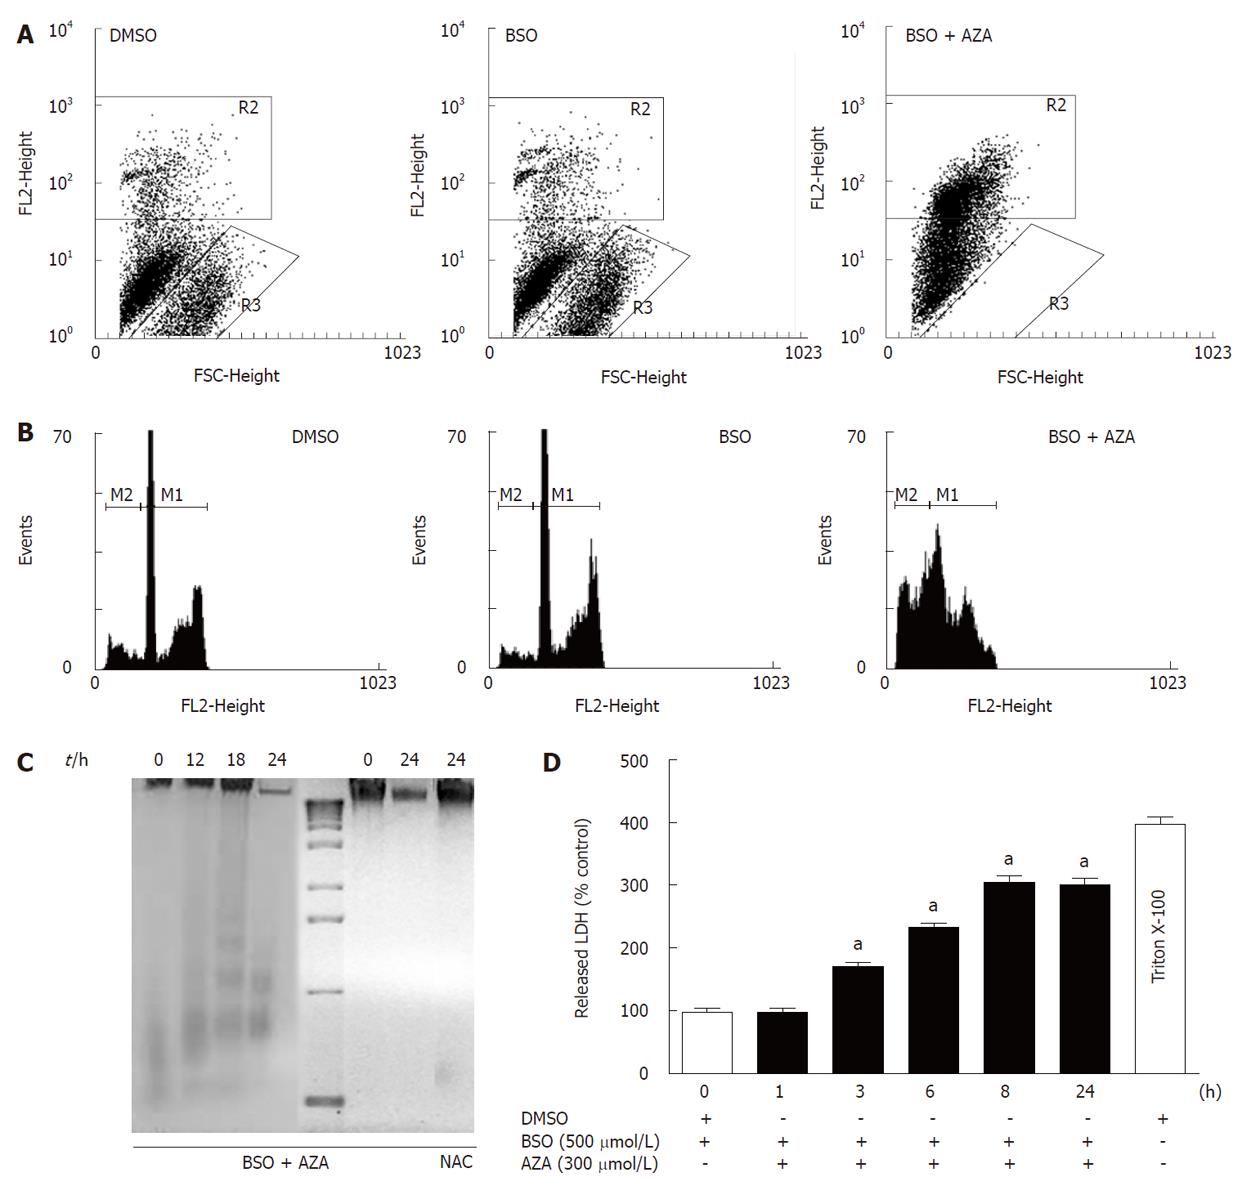
Figure 3 Effect of azathioprine plus buthionine sulfoximine treatment on cell viability, DNA fragmentation and lactate dehydrogenase release.
A: Cell viability of HepG2 cells treated with dimethyl sulfoxide (DMSO) (24 h), buthionine sulfoximine (BSO) (500 μmol/L, 24 h) or pretreated with BSO (500 μmol/L, 24 h) and then cotreated with azathioprine (AZA) (300 μmol/L, 24 h); B: Study of cell cycle of HepG2 cells treated in the same conditions; C: DNA fragmentation of HepG2 cells pretreated with BSO (500 μmol/L, 24 h) and then cotreated with AZA (300 μmol/L) at different times with or without N-acetylcysteine (NAC) (1.5 mmol/L); D: Time course of lactate dehydrogenase (LDH) released by HepG2 cells pretreated with BSO (24 h) and then cotreated with AZA at different times. Triton X-100 (0.2%) used as control. Significant differences with respect to control (DMSO plus BSO) were statistically analyzed by analysis of variance with the Bonferroni post hoc test. aP < 0.001.
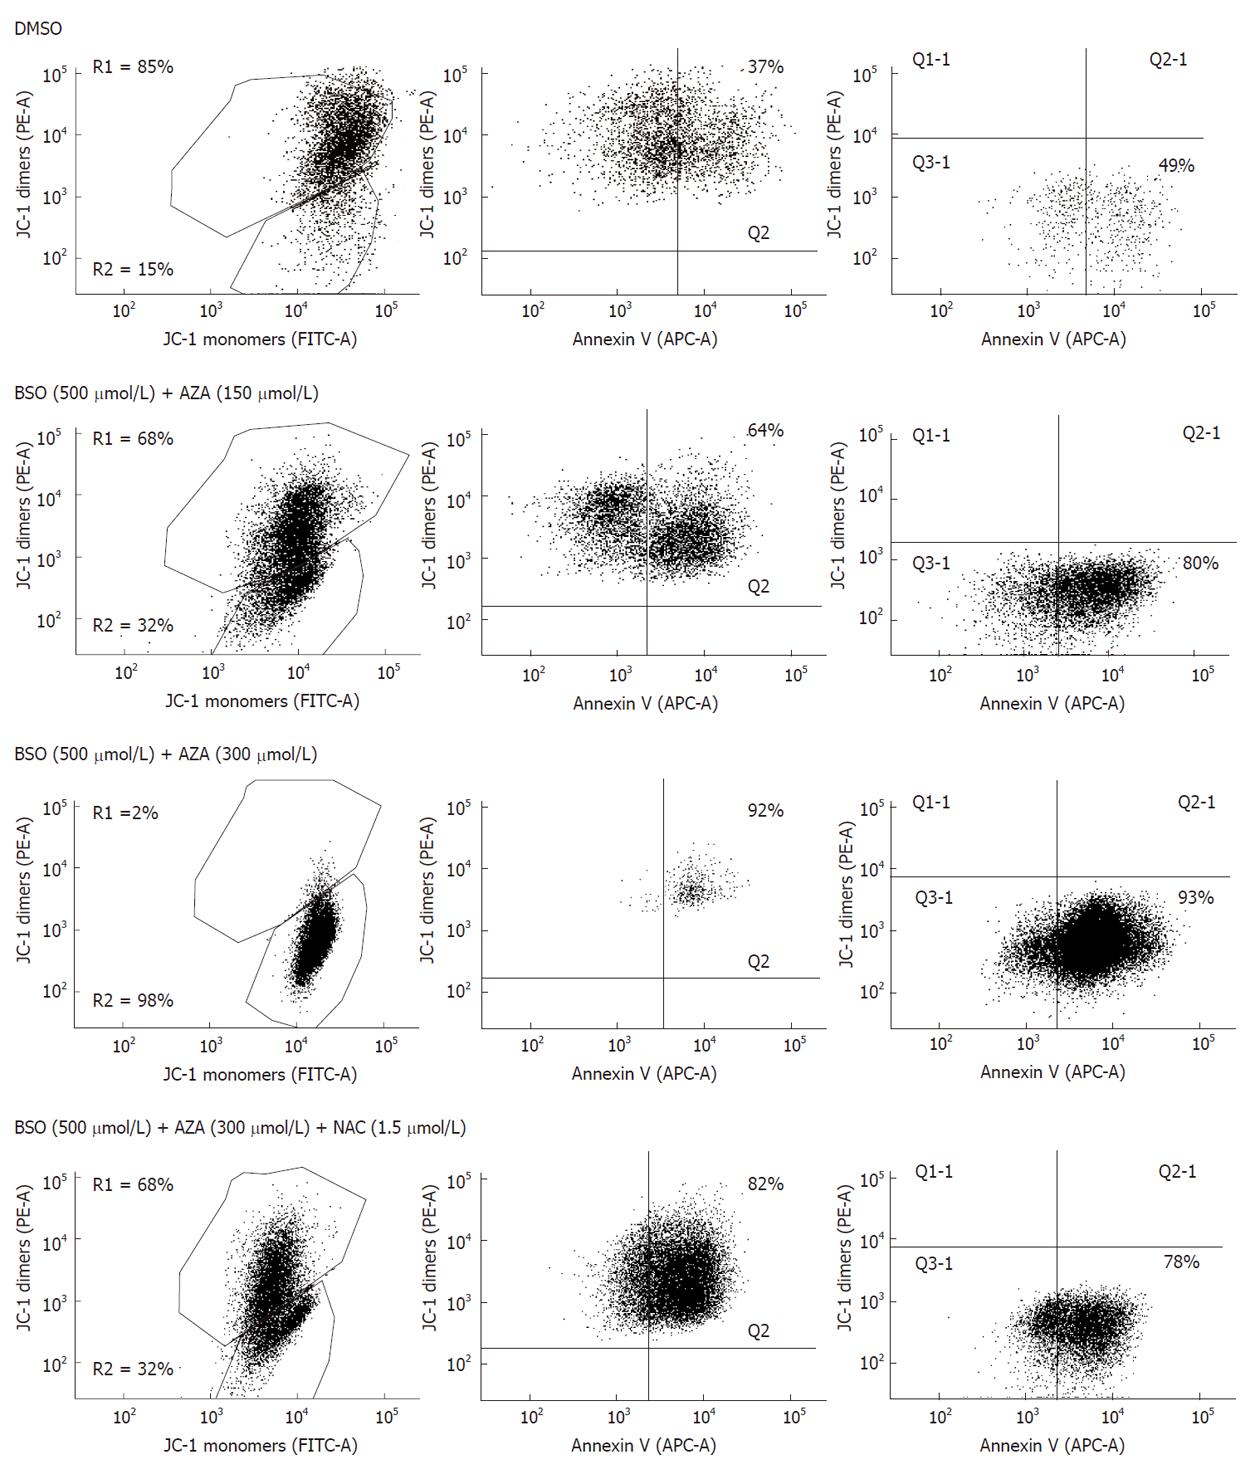
Figure 4 Analysis by flow cytometry of HepG2 cells apoptosis (annexin V) and of mitochondrial functionality (JC-1).
Cells treated with dimethyl sulfoxide (DMSO) (24 h), or pretreated with buthionine sulfoximine (BSO) (24 h) and then cotreated with azathioprine (AZA) (24 h) in absence or presence of N-acetylcysteine (NAC). This experiment is representative of three others with similar results.
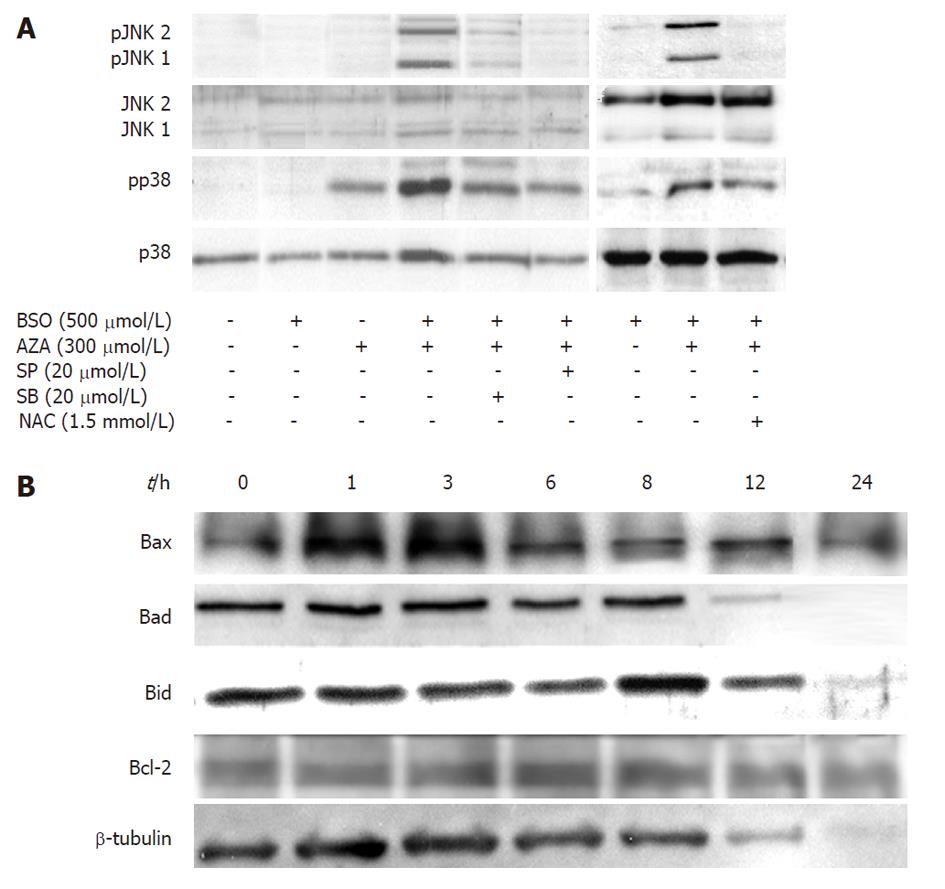
Figure 5 Effect of azathioprine plus buthionine sulfoximine treatment on cellular signaling.
A: Stress activated kinases from HepG2 cells pretreated with buthionine sulfoximine (BSO) (24 h) and then cotreated with different combinations of azathioprine (AZA) with SP600125, SB203580 or N-acetylcysteine (NAC) for 1 h; B: Time course of mitochondrial regulatory proteins from HepG2 cells pretreated with BSO (500 μmol/L, 24 h) and then treated with AZA (300 μmol/L) at different times. This set of experiments is representative of three others with similar results.
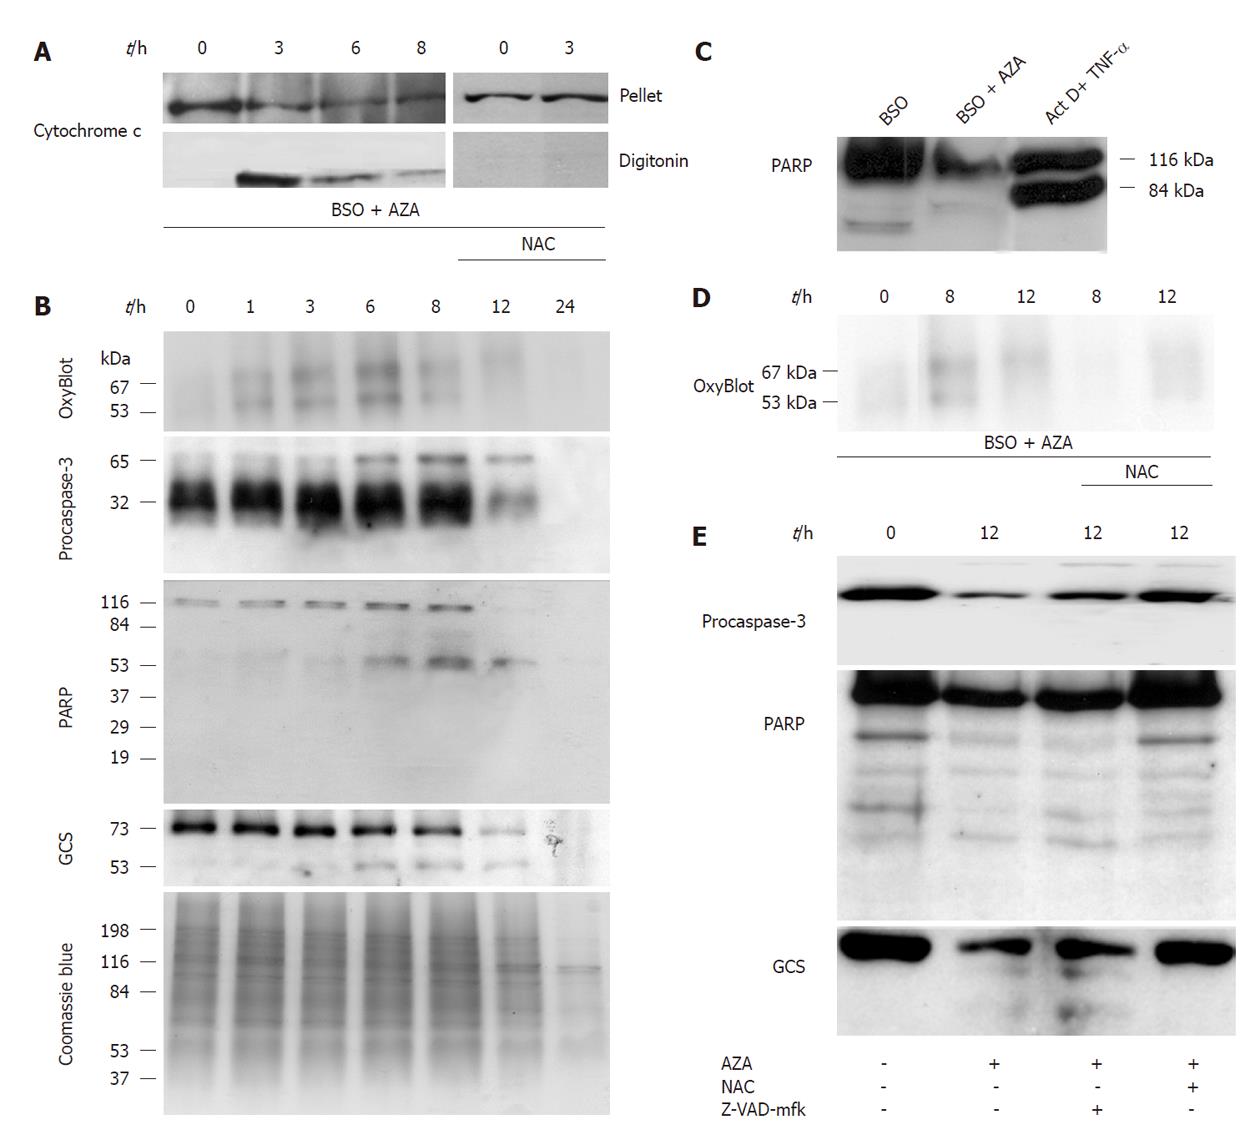
Figure 6 Effect of azathioprine plus buthionine sulfoximine treatment on biochemical markers of apoptosis.
A: Time course of cytochrome c release from HepG2 cells pretreated with buthionine sulfoximine (BSO) (500 μmol/L) during 24 h and then cotreated with azathioprine (AZA) (300 μmol/L) at different times. N-acetylcysteine (NAC) (1.5 mmol/L) was added at the same time as AZA; B: Time course of apoptosis-related proteins in HepG2 cells pretreated with BSO (500 μmol/L) for 24 h and then cotreated with AZA (300 μmol/L) at different times; C: Western blotting of poly(ADP-ribose) polymerase (PARP) from HepG2 cells treated with BSO (500 μmol/L, 24 h) , or pretreated with BSO (500 μmol/L, 24 h) and then cotreated with AZA (300 μmol/L, 12 h). HepG2 cells treated with actinomycin D (0.8 μmol/L) plus tumor necrosis factor (TNF)-α (35 pmol/L) for 18 h were used as positive control; D: Time course of the oxidized proteins from HepG2 cells treated in similar conditions as in panel A; E: Time course of apoptosis-related proteins from HepG2 cells treated in similar conditions as in panel A. NAC (1.5 mmol/L) or Z-VAD-mfk (50 μmol/L) were added at the same time as AZA. This set of experiments is representative of three others with similar results.
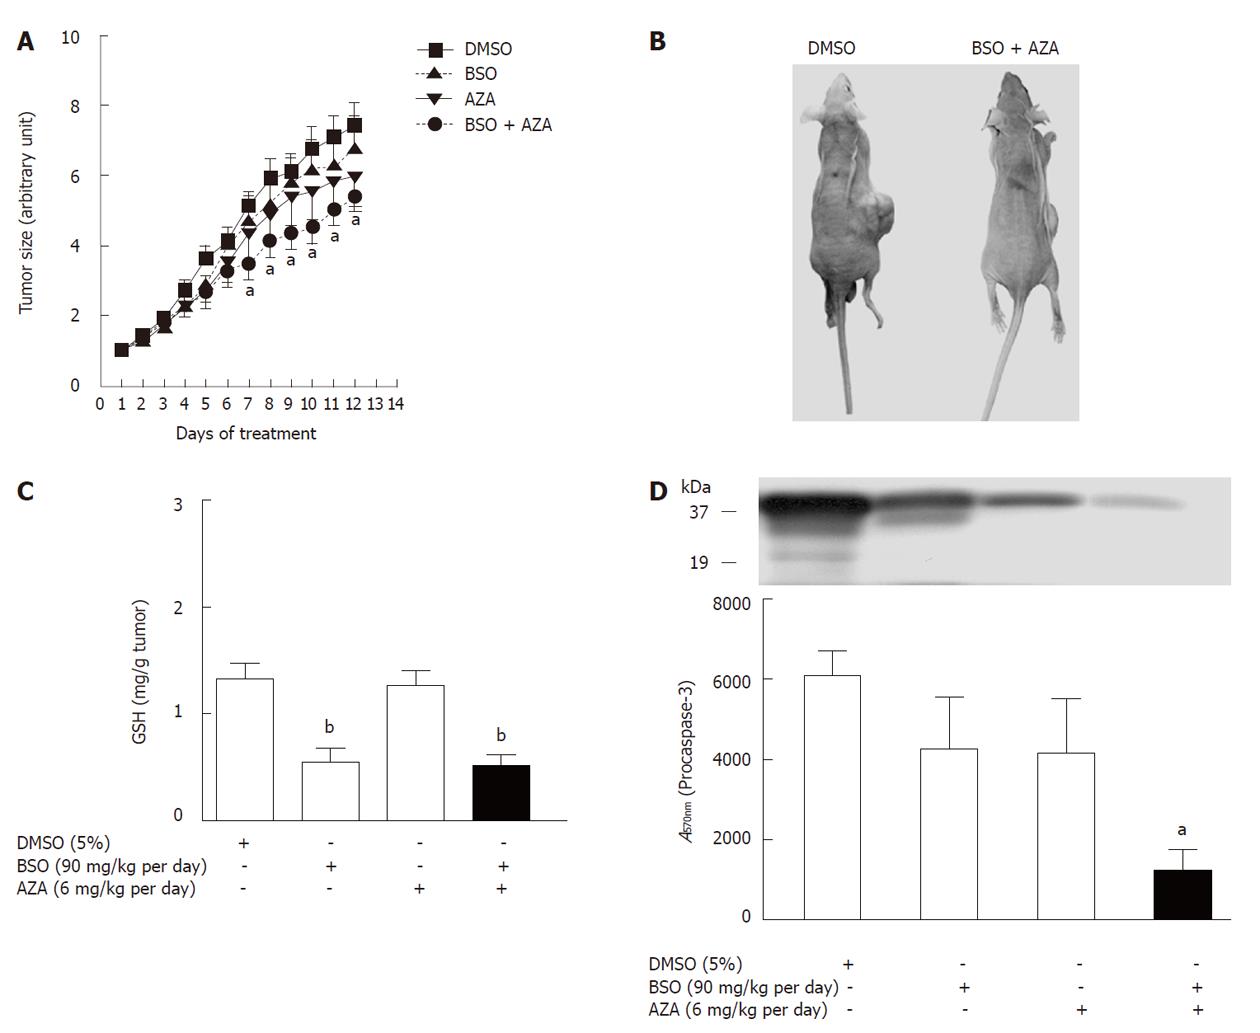
Figure 7 Effect of azathioprine plus buthionine sulfoximine treatment on tumor volume of nude mice.
A: Inhibition of tumor growth by buthionine sulfoximine (BSO) (90 mg/kg per day) plus azathioprine (AZA) (6 mg/kg per day), AZA (6 mg/kg per day) or BSO (90 mg/kg per day). HepG2 cells (107) were implanted subcutaneously into nude mice as described in Materials and Methods; B: Representative animals of the groups treated with dimethyl sulfoxide (DMSO) or BSO plus AZA after 12 d of treatment. Levels of glutathione (GSH) (C) and of procaspase-3 (D) in the tumors of nude mice after 12 d of treatment with the corresponding drugs. There were eight mice in each group. Data points represent the means ± SE. aP < 0.05; bP < 0.01.
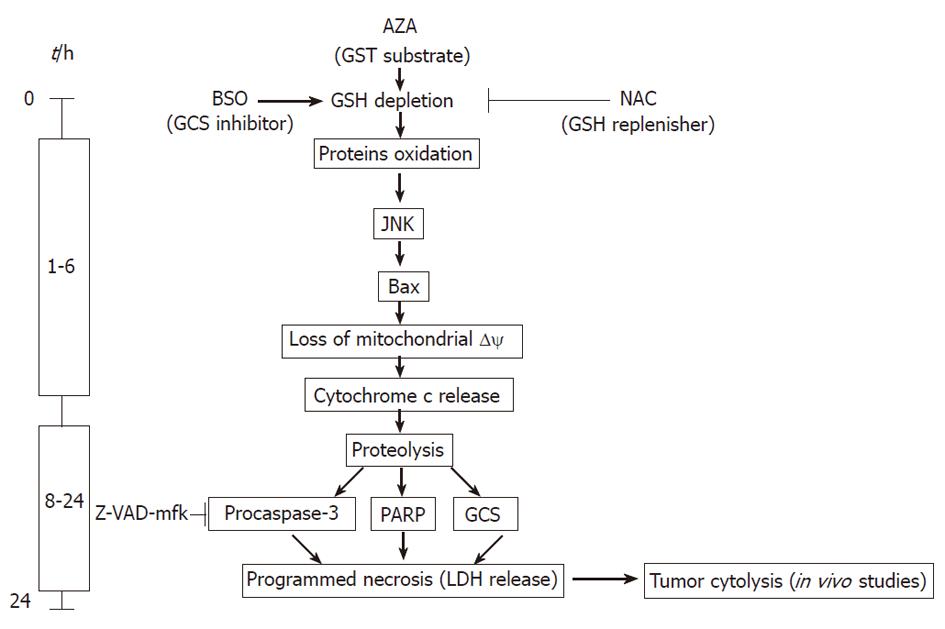
Figure 8 Time course of the events in our molecular model.
AZA: Azathioprine; GST: Glutathione-S-transferase; GSH: Glutathione; GCS: γ-glutamylcysteine synthetase; BSO: Buthionine sulfoximine; NAC: N-acetylcysteine; PARP: Poly (ADP-ribose) polymerase; LDH: Lactate dehydrogenase.
- Citation: Hernández-Breijo B, Monserrat J, Ramírez-Rubio S, Cuevas EP, Vara D, Díaz-Laviada I, Fernández-Moreno MD, Román ID, Gisbert JP, Guijarro LG. Preclinical evaluation of azathioprine plus buthionine sulfoximine in the treatment of human hepatocarcinoma and colon carcinoma. World J Gastroenterol 2011; 17(34): 3899-3911
- URL: https://www.wjgnet.com/1007-9327/full/v17/i34/3899.htm
- DOI: https://dx.doi.org/10.3748/wjg.v17.i34.3899


