Copyright
©2011 Baishideng Publishing Group Co.
World J Gastroenterol. Aug 14, 2011; 17(30): 3479-3486
Published online Aug 14, 2011. doi: 10.3748/wjg.v17.i30.3479
Published online Aug 14, 2011. doi: 10.3748/wjg.v17.i30.3479
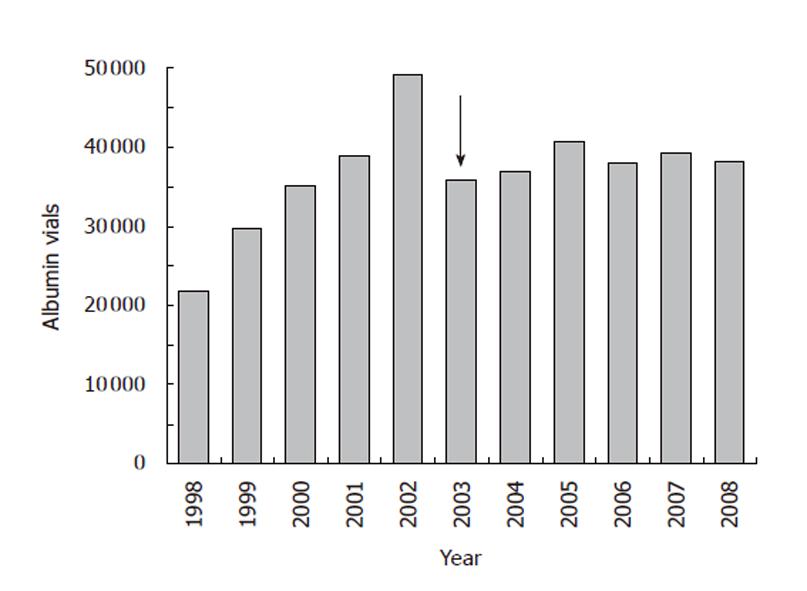
Figure 1 Annual consumption of albumin vials (50 mL, 20%) at the S Orsola-Malpighi University Hospital, Bologna, Italy.
The black arrow indicates when the practical guidelines for in-hospital albumin prescription were implemented in July 2003.
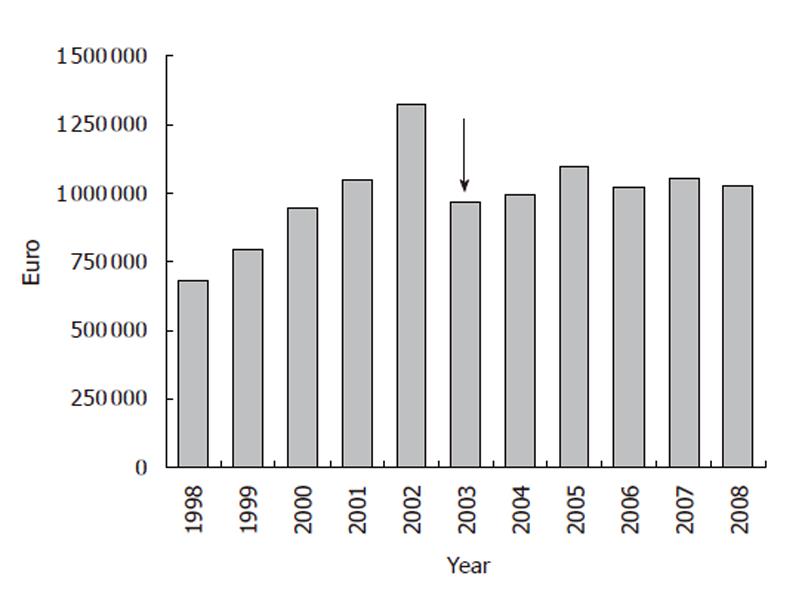
Figure 2 Global annual cost of albumin use at the S Orsola-Malpighi University Hospital, Bologna, Italy.
The black arrow indicates when the practical guidelines for in-hospital albumin prescription were implemented in July 2003.
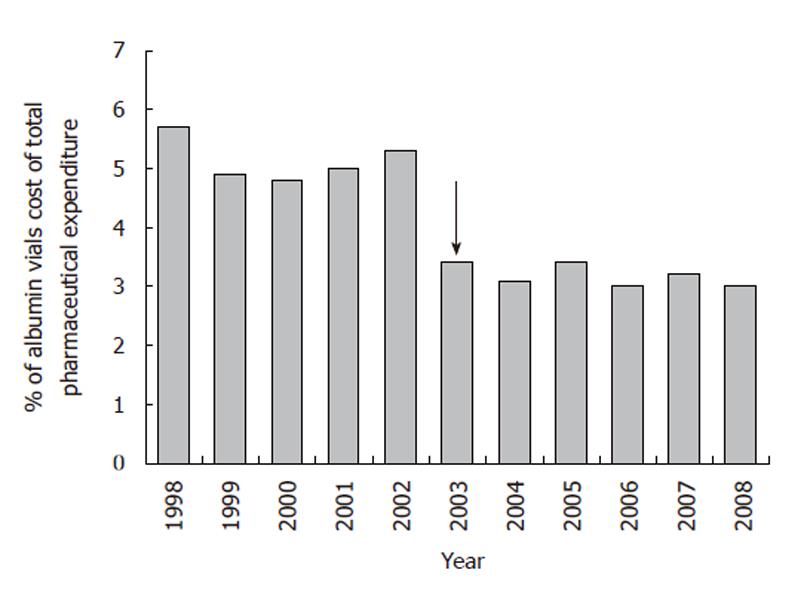
Figure 3 Annual cost of albumin use at the S Orsola-Malpighi University Hospital, Bologna, Italy, expressed as a percentage of the total pharmaceutical expenditure.
The black arrow indicates when the practical guidelines for in-hospital albumin prescription were implemented in July 2003.
Figure 4 Top panel.
Trend in albumin consumption at the S Orsola-Malpighi University Hospital, Bologna, Italy before implementation of the practical guidelines for albumin prescription. Albumin consumption is expressed per semester from January 1, 1998 to June 30, 2003. Data are analyzed using the Pearson correlation. Bottom panel. Trend in albumin consumption at the S. Orsola-Malpighi University Hospital, Bologna, Italy after implementation of the practical guidelines for albumin prescription. Albumin consumption is expressed per semester from July 1, 2003 to December 31, 2008. Data are analyzed using the Pearson correlation.
Figure 5 Distribution of the annual consumption of albumin vials (50 mL, 20%) among various Units of the S Orsola-Malpighi University Hospital, Bologna, Italy, grouped into three main categories: hepatological medical and surgical units, i.
e. units representing a referral centre for liver diseases, non-hepatological medical and surgical units, and
- Citation: Mirici-Cappa F, Caraceni P, Domenicali M, Gelonesi E, Benazzi B, Zaccherini G, Trevisani F, Puggioli C, Bernardi M. How albumin administration for cirrhosis impacts on hospital albumin consumption and expenditure. World J Gastroenterol 2011; 17(30): 3479-3486
- URL: https://www.wjgnet.com/1007-9327/full/v17/i30/3479.htm
- DOI: https://dx.doi.org/10.3748/wjg.v17.i30.3479


