Copyright
©2011 Baishideng Publishing Group Co.
World J Gastroenterol. Jan 21, 2011; 17(3): 334-342
Published online Jan 21, 2011. doi: 10.3748/wjg.v17.i3.334
Published online Jan 21, 2011. doi: 10.3748/wjg.v17.i3.334
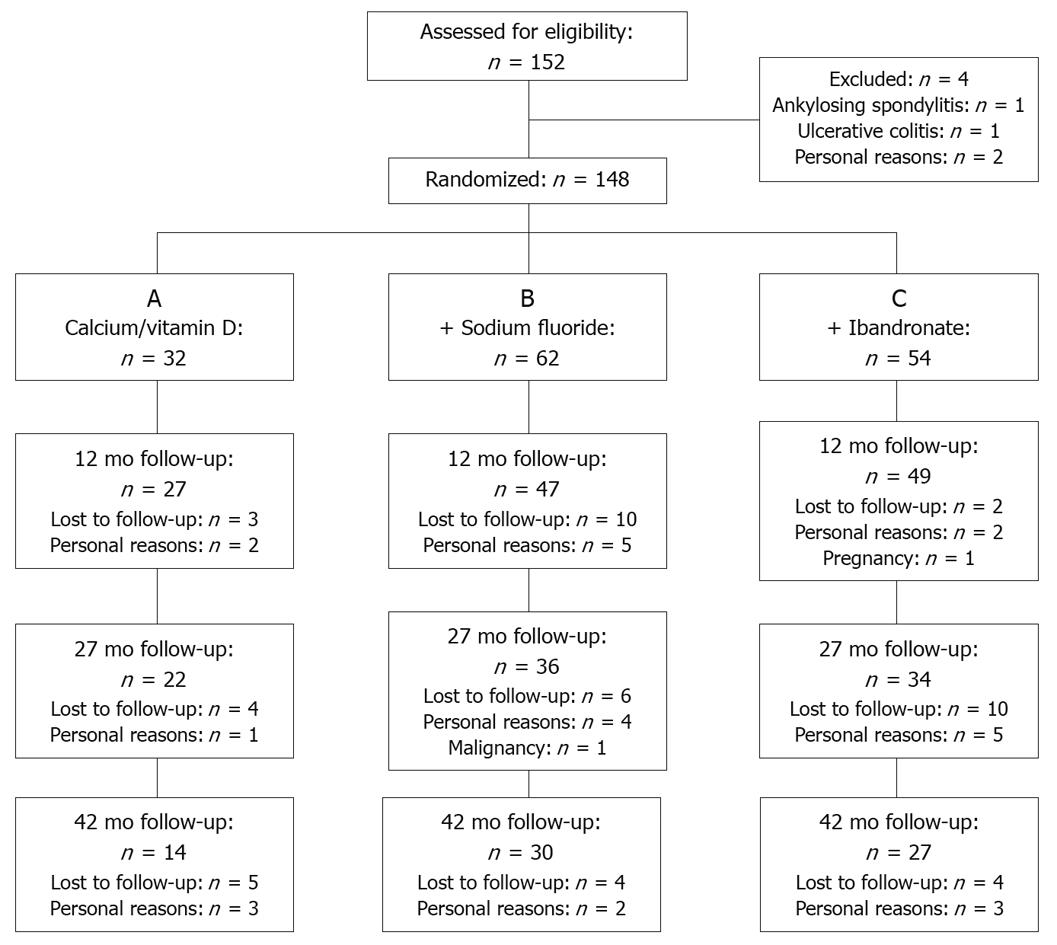
Figure 1 CONSORT diagram.
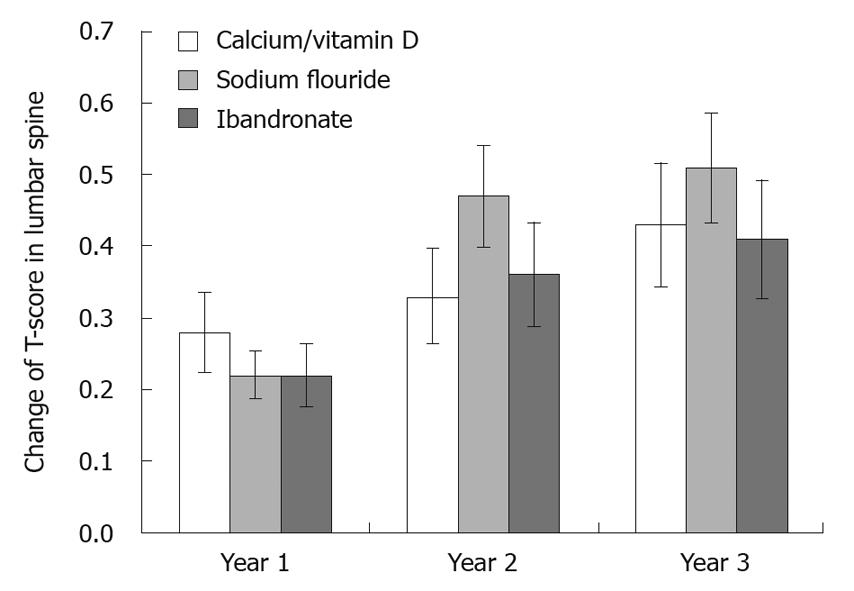
Figure 2 Change in T-score of the lumbar spine from baseline to first, second and third study year, during the 3.
5-year long-term study in treatment groups A, B or C, in the per protocol population.
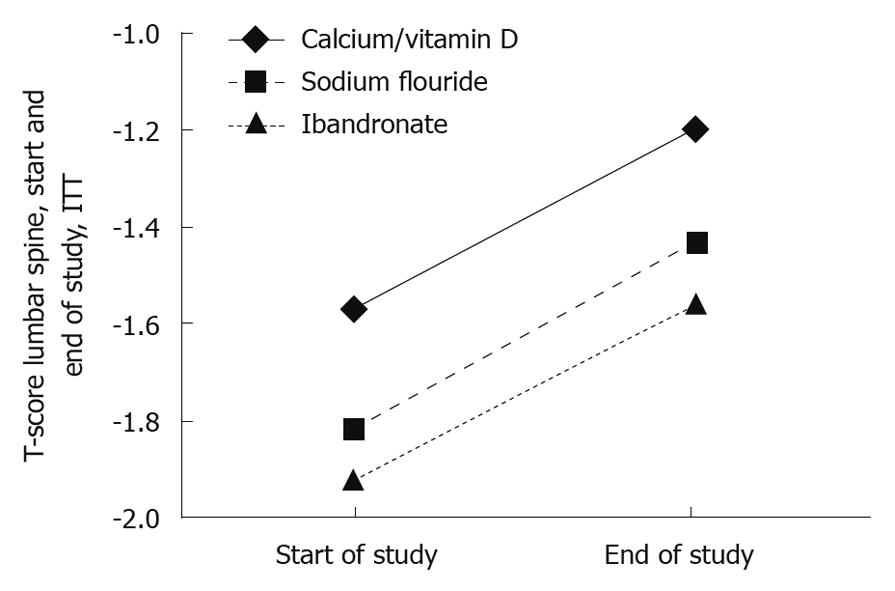
Figure 3 T-score of the lumbar spine from baseline to end of study depending in treatment groups A, B or C, in the intention to treat population.
ITT: Intention-to-treat.
- Citation: Klaus J, Reinshagen M, Herdt K, Schröter C, Adler G, Boyen GBV, Tirpitz CV. Bones and Crohn’s: No benefit of adding sodium fluoride or ibandronate to calcium and vitamin D. World J Gastroenterol 2011; 17(3): 334-342
- URL: https://www.wjgnet.com/1007-9327/full/v17/i3/334.htm
- DOI: https://dx.doi.org/10.3748/wjg.v17.i3.334


