Copyright
©2011 Baishideng Publishing Group Co.
World J Gastroenterol. Jun 28, 2011; 17(24): 2945-2952
Published online Jun 28, 2011. doi: 10.3748/wjg.v17.i24.2945
Published online Jun 28, 2011. doi: 10.3748/wjg.v17.i24.2945
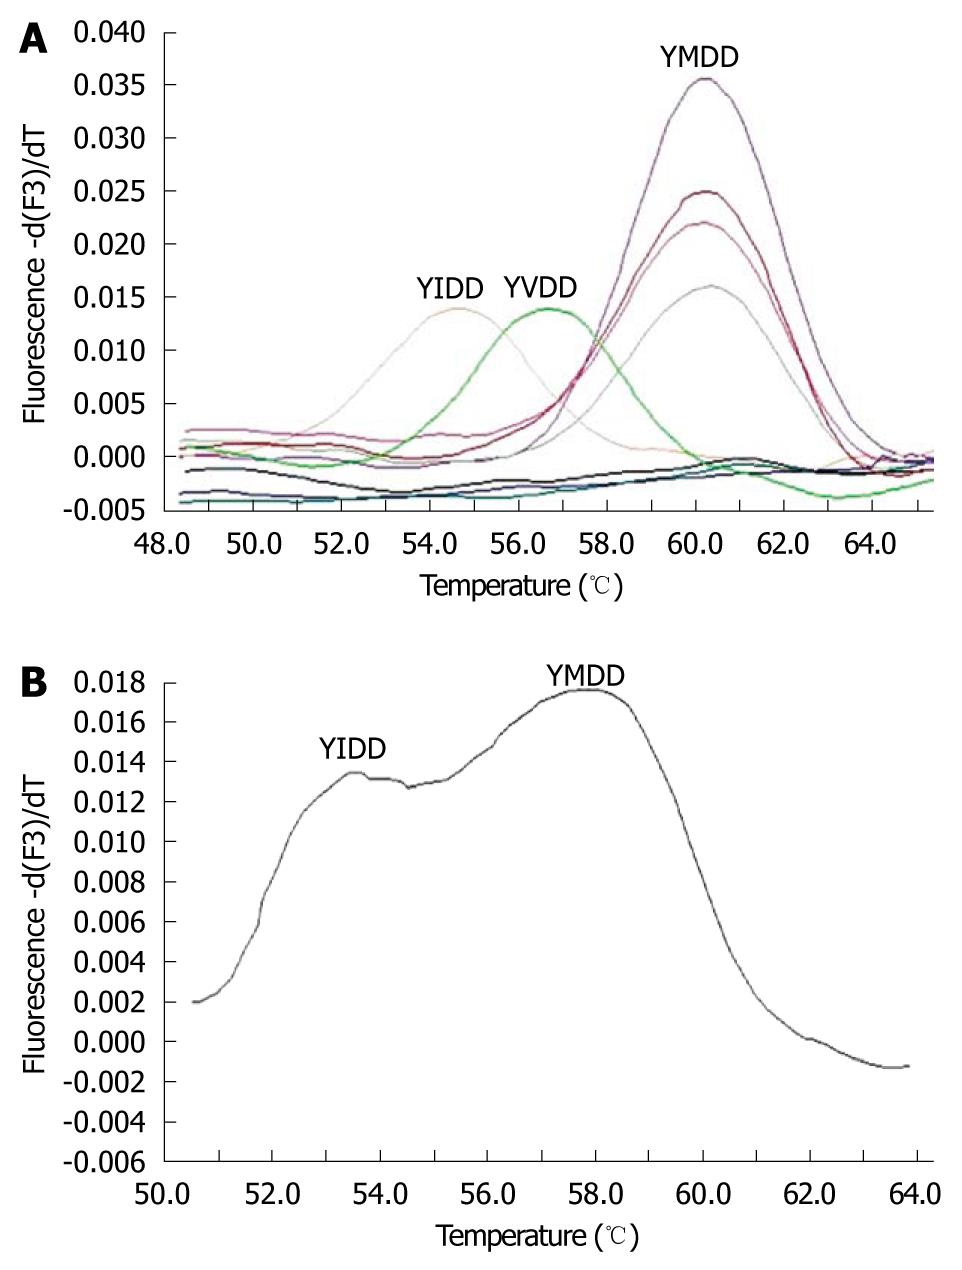
Figure 1 Melting curve analysis using the LightCycler probe hybridization assay.
The melting curves were converted to melting peaks by plotting the negative derivative of fluorescence with respect to temperature [-d(F3)/dT]. The melting temperature (Tm) for each of the YMDD mutants is indicated with a vertical line. A: Representative results for differentiating HBV YMDD mutants. YMDD, YVDD and YIDD mutants showed distinct Tm values; B: The shoulder curve indicated the mixed mutant-type. Representative results show YMDD + YIDD mutants.
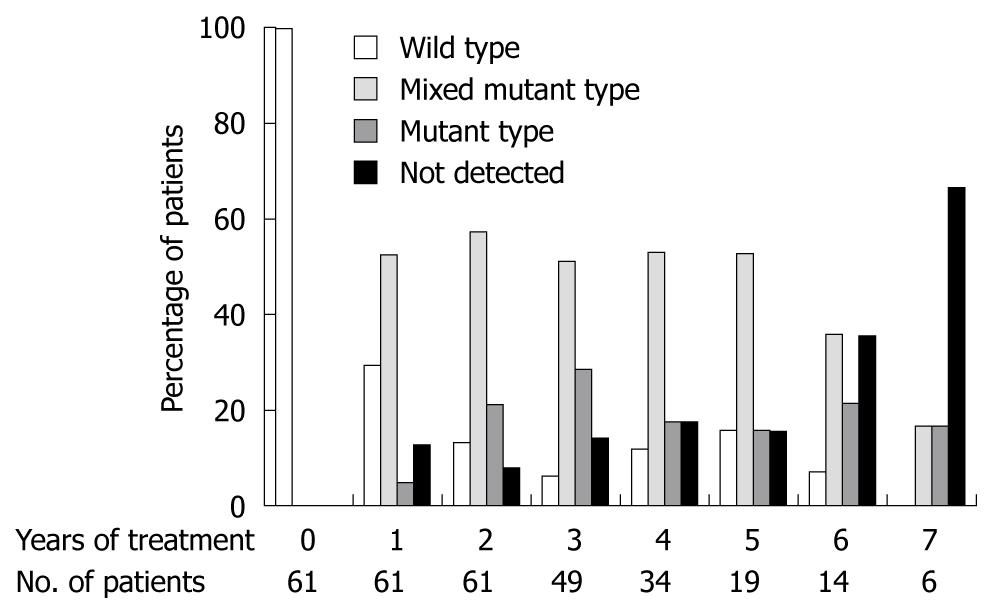
Figure 2 Change in the proportion of YMDD wild, mixed mutant, and mutant-types during lamivudine treatment.
- Citation: Murata M, Furusyo N, Unno M, Ogawa E, Toyoda K, Taniai H, Ohnishi H, Hayashi J. Long-term effects of lamivudine treatment in Japanese chronic hepatitis B patients. World J Gastroenterol 2011; 17(24): 2945-2952
- URL: https://www.wjgnet.com/1007-9327/full/v17/i24/2945.htm
- DOI: https://dx.doi.org/10.3748/wjg.v17.i24.2945


