Copyright
©2011 Baishideng Publishing Group Co.
World J Gastroenterol. Jun 7, 2011; 17(21): 2646-2651
Published online Jun 7, 2011. doi: 10.3748/wjg.v17.i21.2646
Published online Jun 7, 2011. doi: 10.3748/wjg.v17.i21.2646
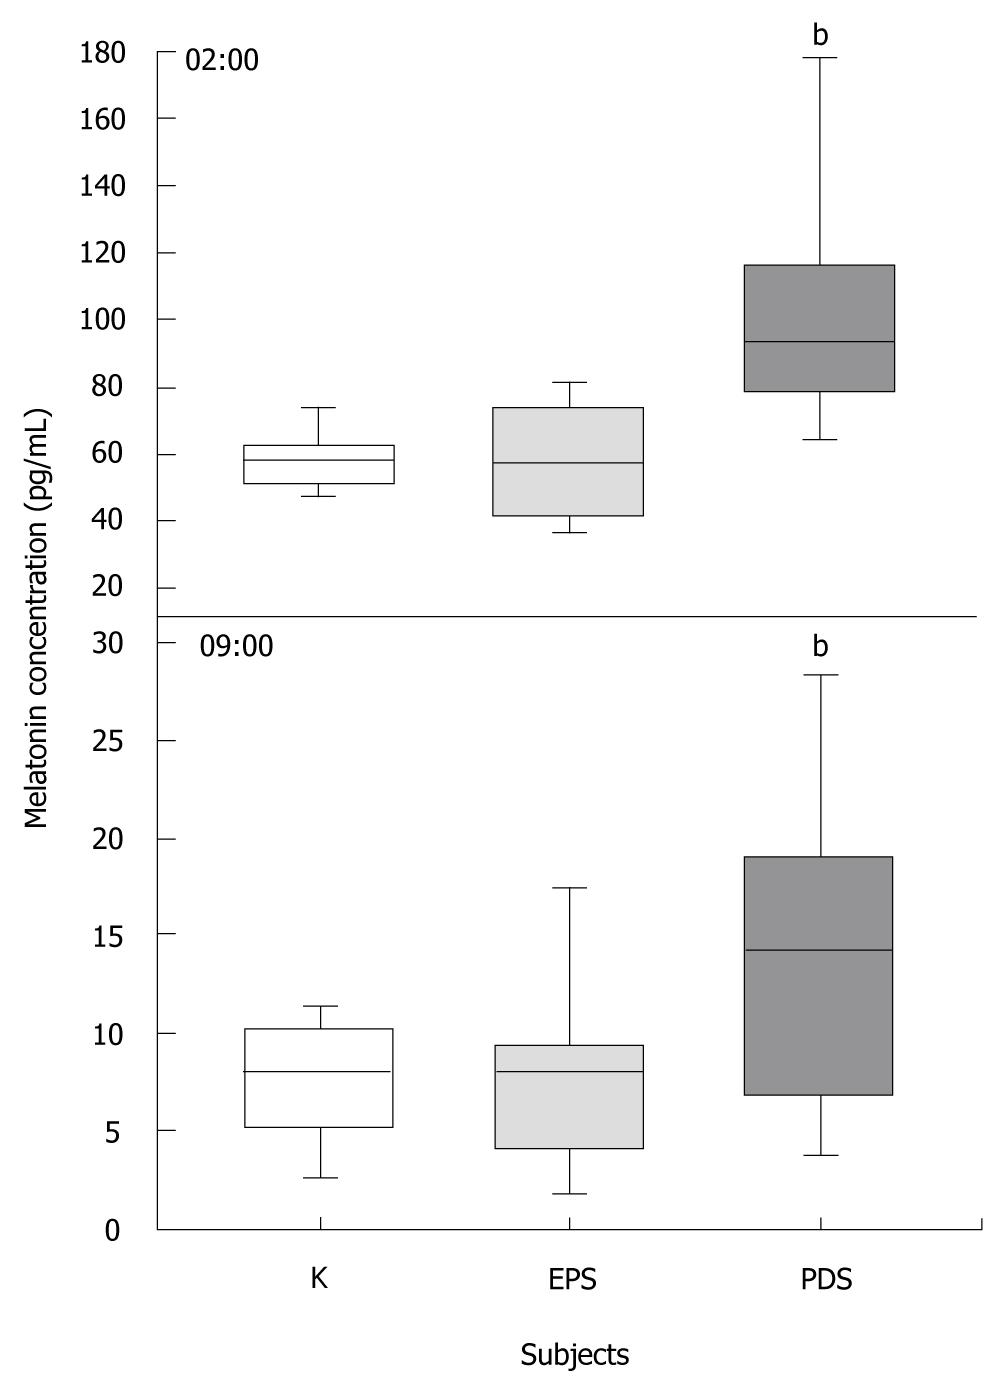
Figure 1 Serum melatonin concentrations at 02:00 h and 09:00 h in healthy subjects (K, clear bar, n = 30) and epigastric pain syndrome (grey bar, n = 30) and postprandial distress syndrome (dark grey bar, n = 30).
Box represents median with 25th and 75th percentiles (lower and upper quartiles, respectively). The ends of the error bars represent the smallest and largest measurements in the study groups. bP < 0.001. PDS: Postprandial distress syndrome; EPS: Epigastric pain syndrome.
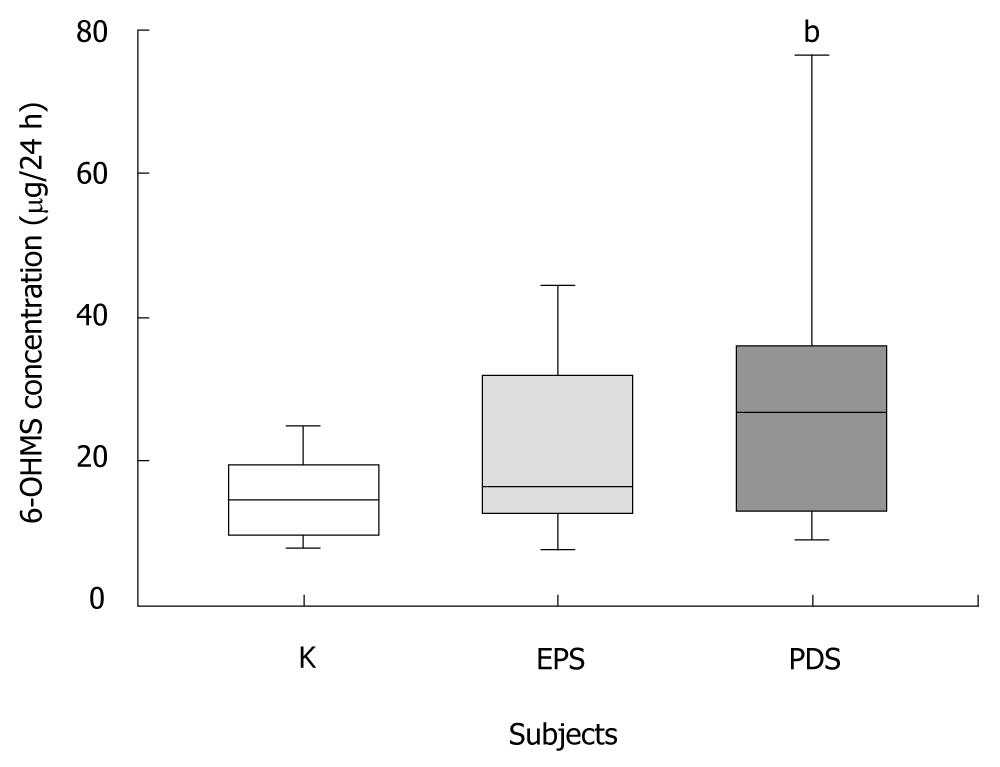
Figure 2 Twenty-four-hour urinary excretion of 6-OHMS in healthy subjects (K, clear bar, n = 30) and in patients with epigastric pain syndrome (grey bar, n = 30) and postprandial distress syndrome (dark grey, n = 30).
Box represents median with 25th and 75th percentiles (lower and upper quartiles, respectively). The ends of the error bars represent the smallest and largest measurements in the study groups. bP < 0.01. PDS: Postprandial distress syndrome; EPS: Epigastric pain syndrome.
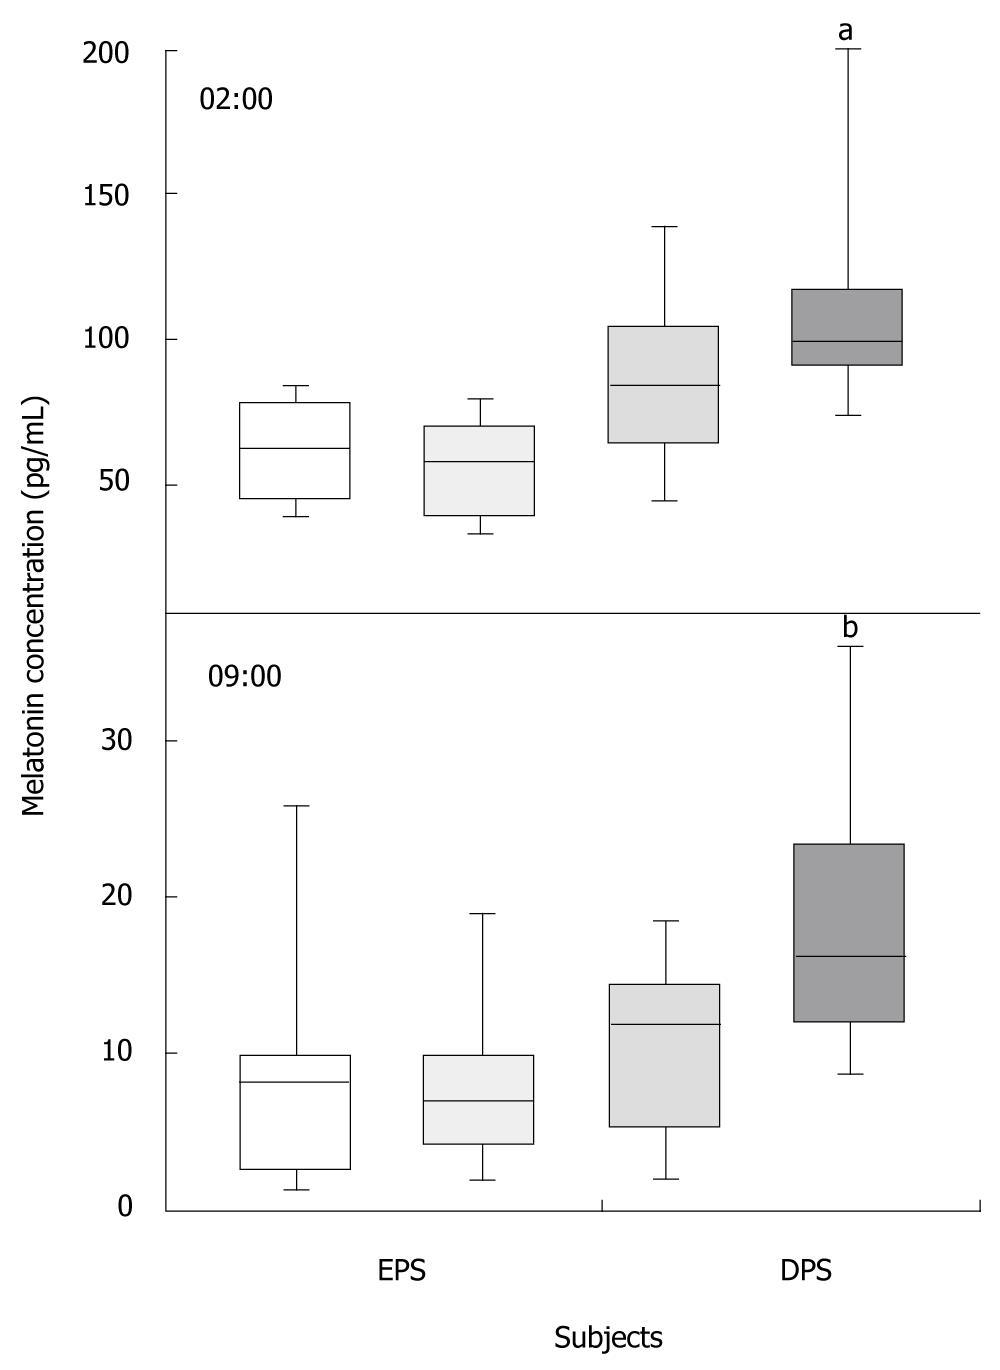
Figure 3 Serum melatonin concentrations at 02:00 h and at 9.
00 a.m. in patients with epigastric pain syndrome (two shades of light grey, n = 30) and postprandial distress syndrome (two shades of dark grey, n = 30). Darker bars represent patients with severe symptoms [n = 16 for epigastric pain syndrome (EPS) and n = 15 for postprandial distress syndrome (PDS)] and lighter bars, patients with moderate symptoms (n = 14 for EPS and n = 15 for PDS). Box represents median with 25th and 75th percentiles (lower and upper quartiles, respectively). The ends of the error bars represent the smallest and largest measurements in the study groups. aP < 0.05, bP < 0.01.
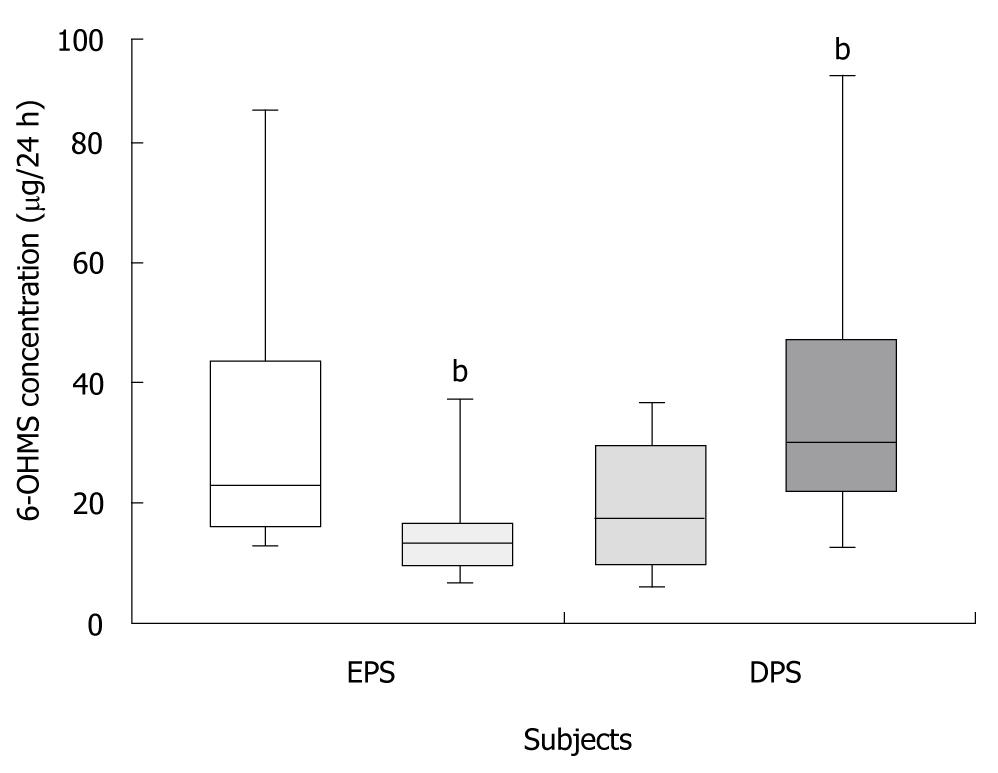
Figure 4 Twenty-four-hour urinary 6-OHMS excretion in patients with epigastric pain syndrome (two shades of light grey, n = 30) and postprandial distress syndrome (two shades of dark grey, n = 30).
Darker bars represent patients with severe symptoms (n = 16 for epigastric pain syndrome (EPS) and n = 15 for postprandial distress syndrome (PDS)) and lighter bars, patients with moderate symptoms (n = 14 for EPS and n = 15 for PDS). Box represents median with 25th and 75th percentiles (lower and upper quartiles, respectively). The ends of the error bars represent the smallest and largest measurements in studied groups. bP < 0.01.
- Citation: Chojnacki C, Poplawski T, Klupinska G, Blasiak J, Chojnacki J, Reiter RJ. Secretion of melatonin and 6-sulfatoxymelatonin urinary excretion in functional dyspepsia. World J Gastroenterol 2011; 17(21): 2646-2651
- URL: https://www.wjgnet.com/1007-9327/full/v17/i21/2646.htm
- DOI: https://dx.doi.org/10.3748/wjg.v17.i21.2646


