Copyright
©2011 Baishideng Publishing Group Co.
World J Gastroenterol. May 7, 2011; 17(17): 2206-2210
Published online May 7, 2011. doi: 10.3748/wjg.v17.i17.2206
Published online May 7, 2011. doi: 10.3748/wjg.v17.i17.2206
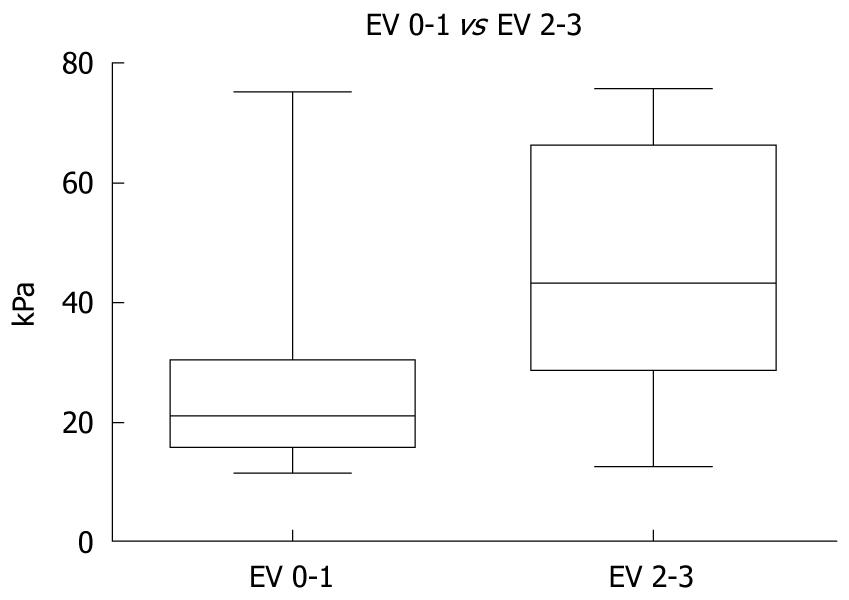
Figure 1 Mean liver stiffness values in patients with no or grade 1 esophageal varices as compared to those with significant esophageal varices (grade 2 and 3).
Whiskers = minimum and maximum. EV: Esophageal varices.
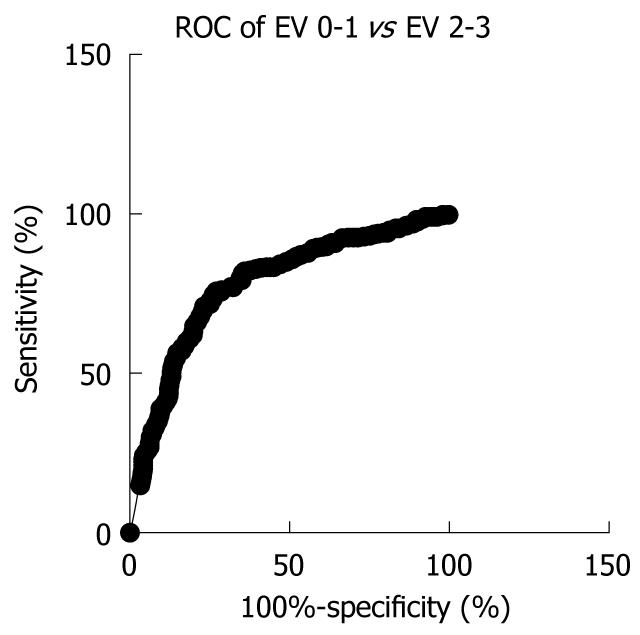
Figure 2 Predictive value of liver stiffness for the presence of at least grade 2 esophageal varices.
ROC: Receiver operating characteristic.
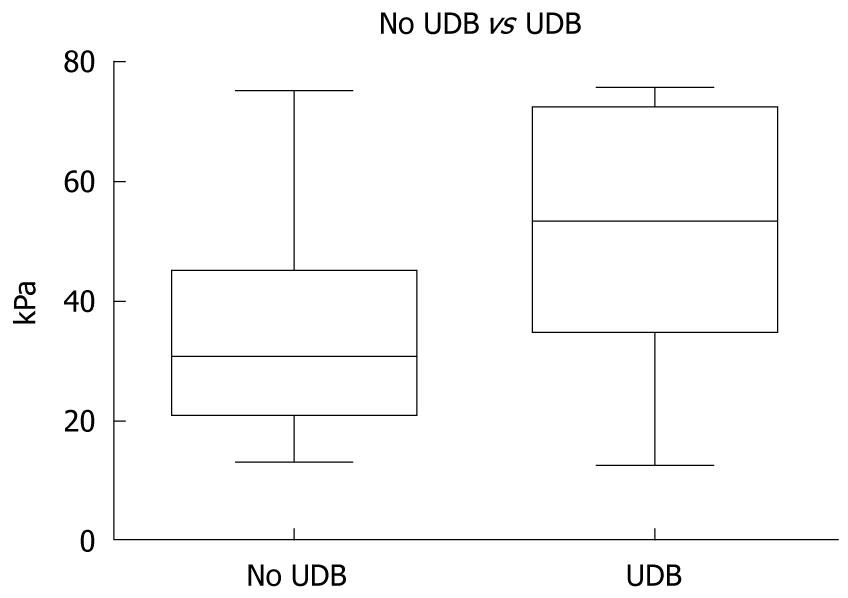
Figure 3 Mean liver stiffness values in patients with upper digestive bleeding due to variceal bleeding as compared to those without upper digestive bleeding.
Whiskers = minimum and maximum. UDB: Upper digestive bleeding.
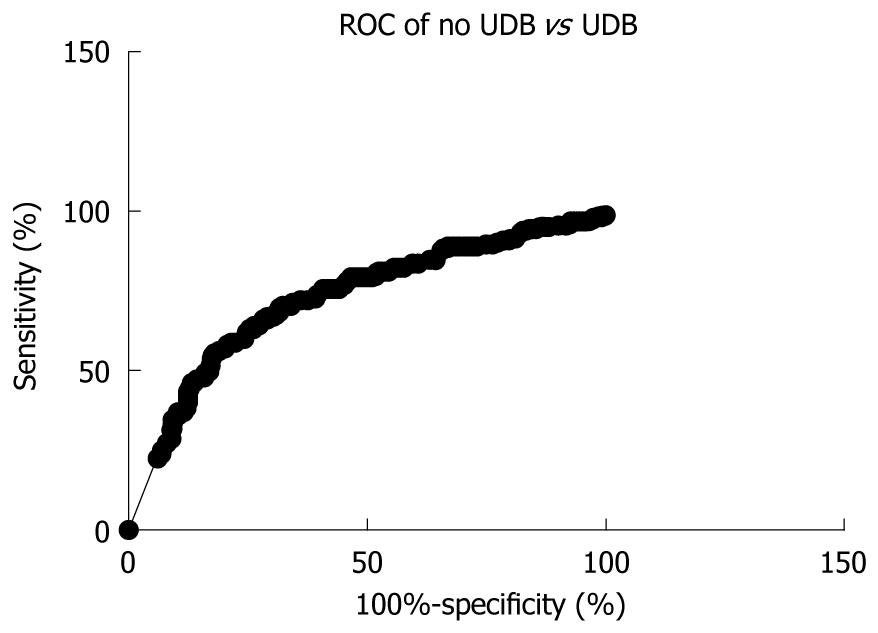
Figure 4 Predictive value of liver stiffness for upper digestive bleeding due to variceal bleeding.
UDB: Upper digestive bleeding.
- Citation: Sporea I, Raţiu I, Şirli R, Popescu A, Bota S. Value of transient elastography for the prediction of variceal bleeding. World J Gastroenterol 2011; 17(17): 2206-2210
- URL: https://www.wjgnet.com/1007-9327/full/v17/i17/2206.htm
- DOI: https://dx.doi.org/10.3748/wjg.v17.i17.2206


