Copyright
©2011 Baishideng Publishing Group Co.
World J Gastroenterol. May 7, 2011; 17(17): 2191-2198
Published online May 7, 2011. doi: 10.3748/wjg.v17.i17.2191
Published online May 7, 2011. doi: 10.3748/wjg.v17.i17.2191
Figure 1 CD8+CD38+ T cell proportions in hepatitis B patients, hepatitis B virus carriers and healthy controls.
Levels of CD8+CD38+ T cells in chronic hepatitis B patients were markedly higher than those of the other two groups. HBV: Hepatitis B virus.
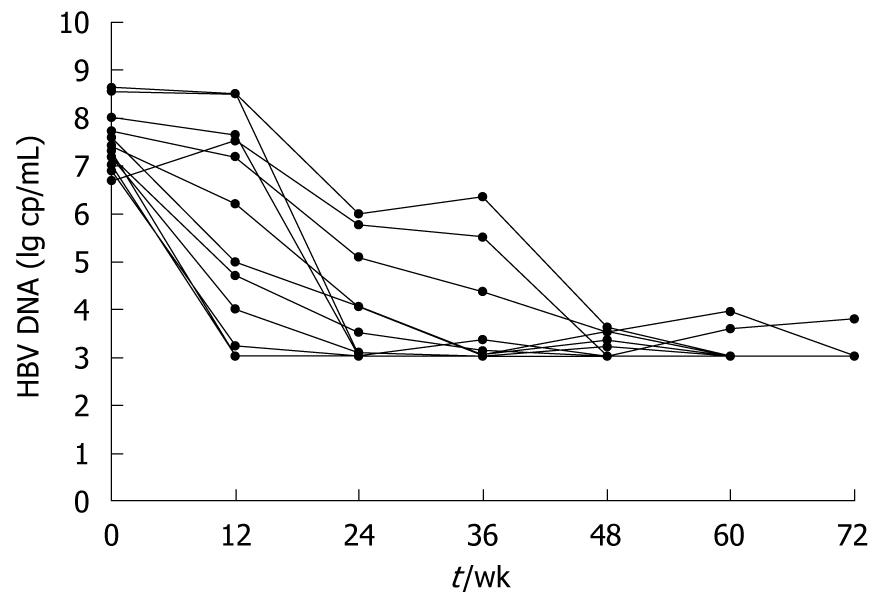
Figure 2 Hepatitis B viral load changes of the 13 patients who responded well to adefovir dipivoxil, by week of treatment.
HBV: Hepatitis B virus.
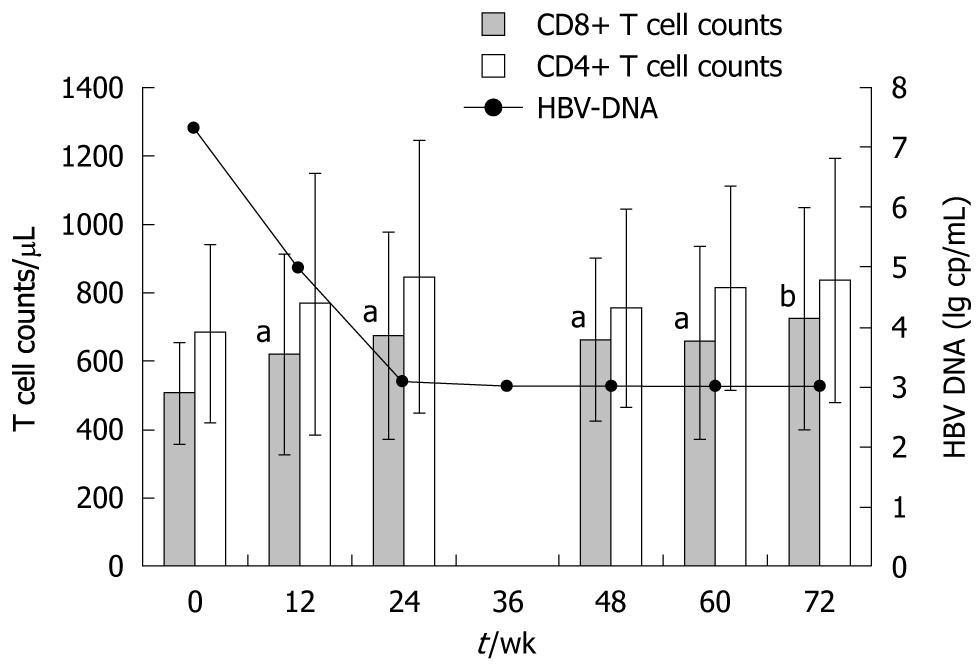
Figure 3 Changes of CD3+CD8+ and CD3+CD4+ T cell counts and median hepatitis B virus DNA in good responders, by week of adefovir dipivoxil treatment.
aP < 0.05, bP < 0.01 vs baseline T cell counts before adefovir dipivoxil treatment. HBV: Hepatitis B virus.
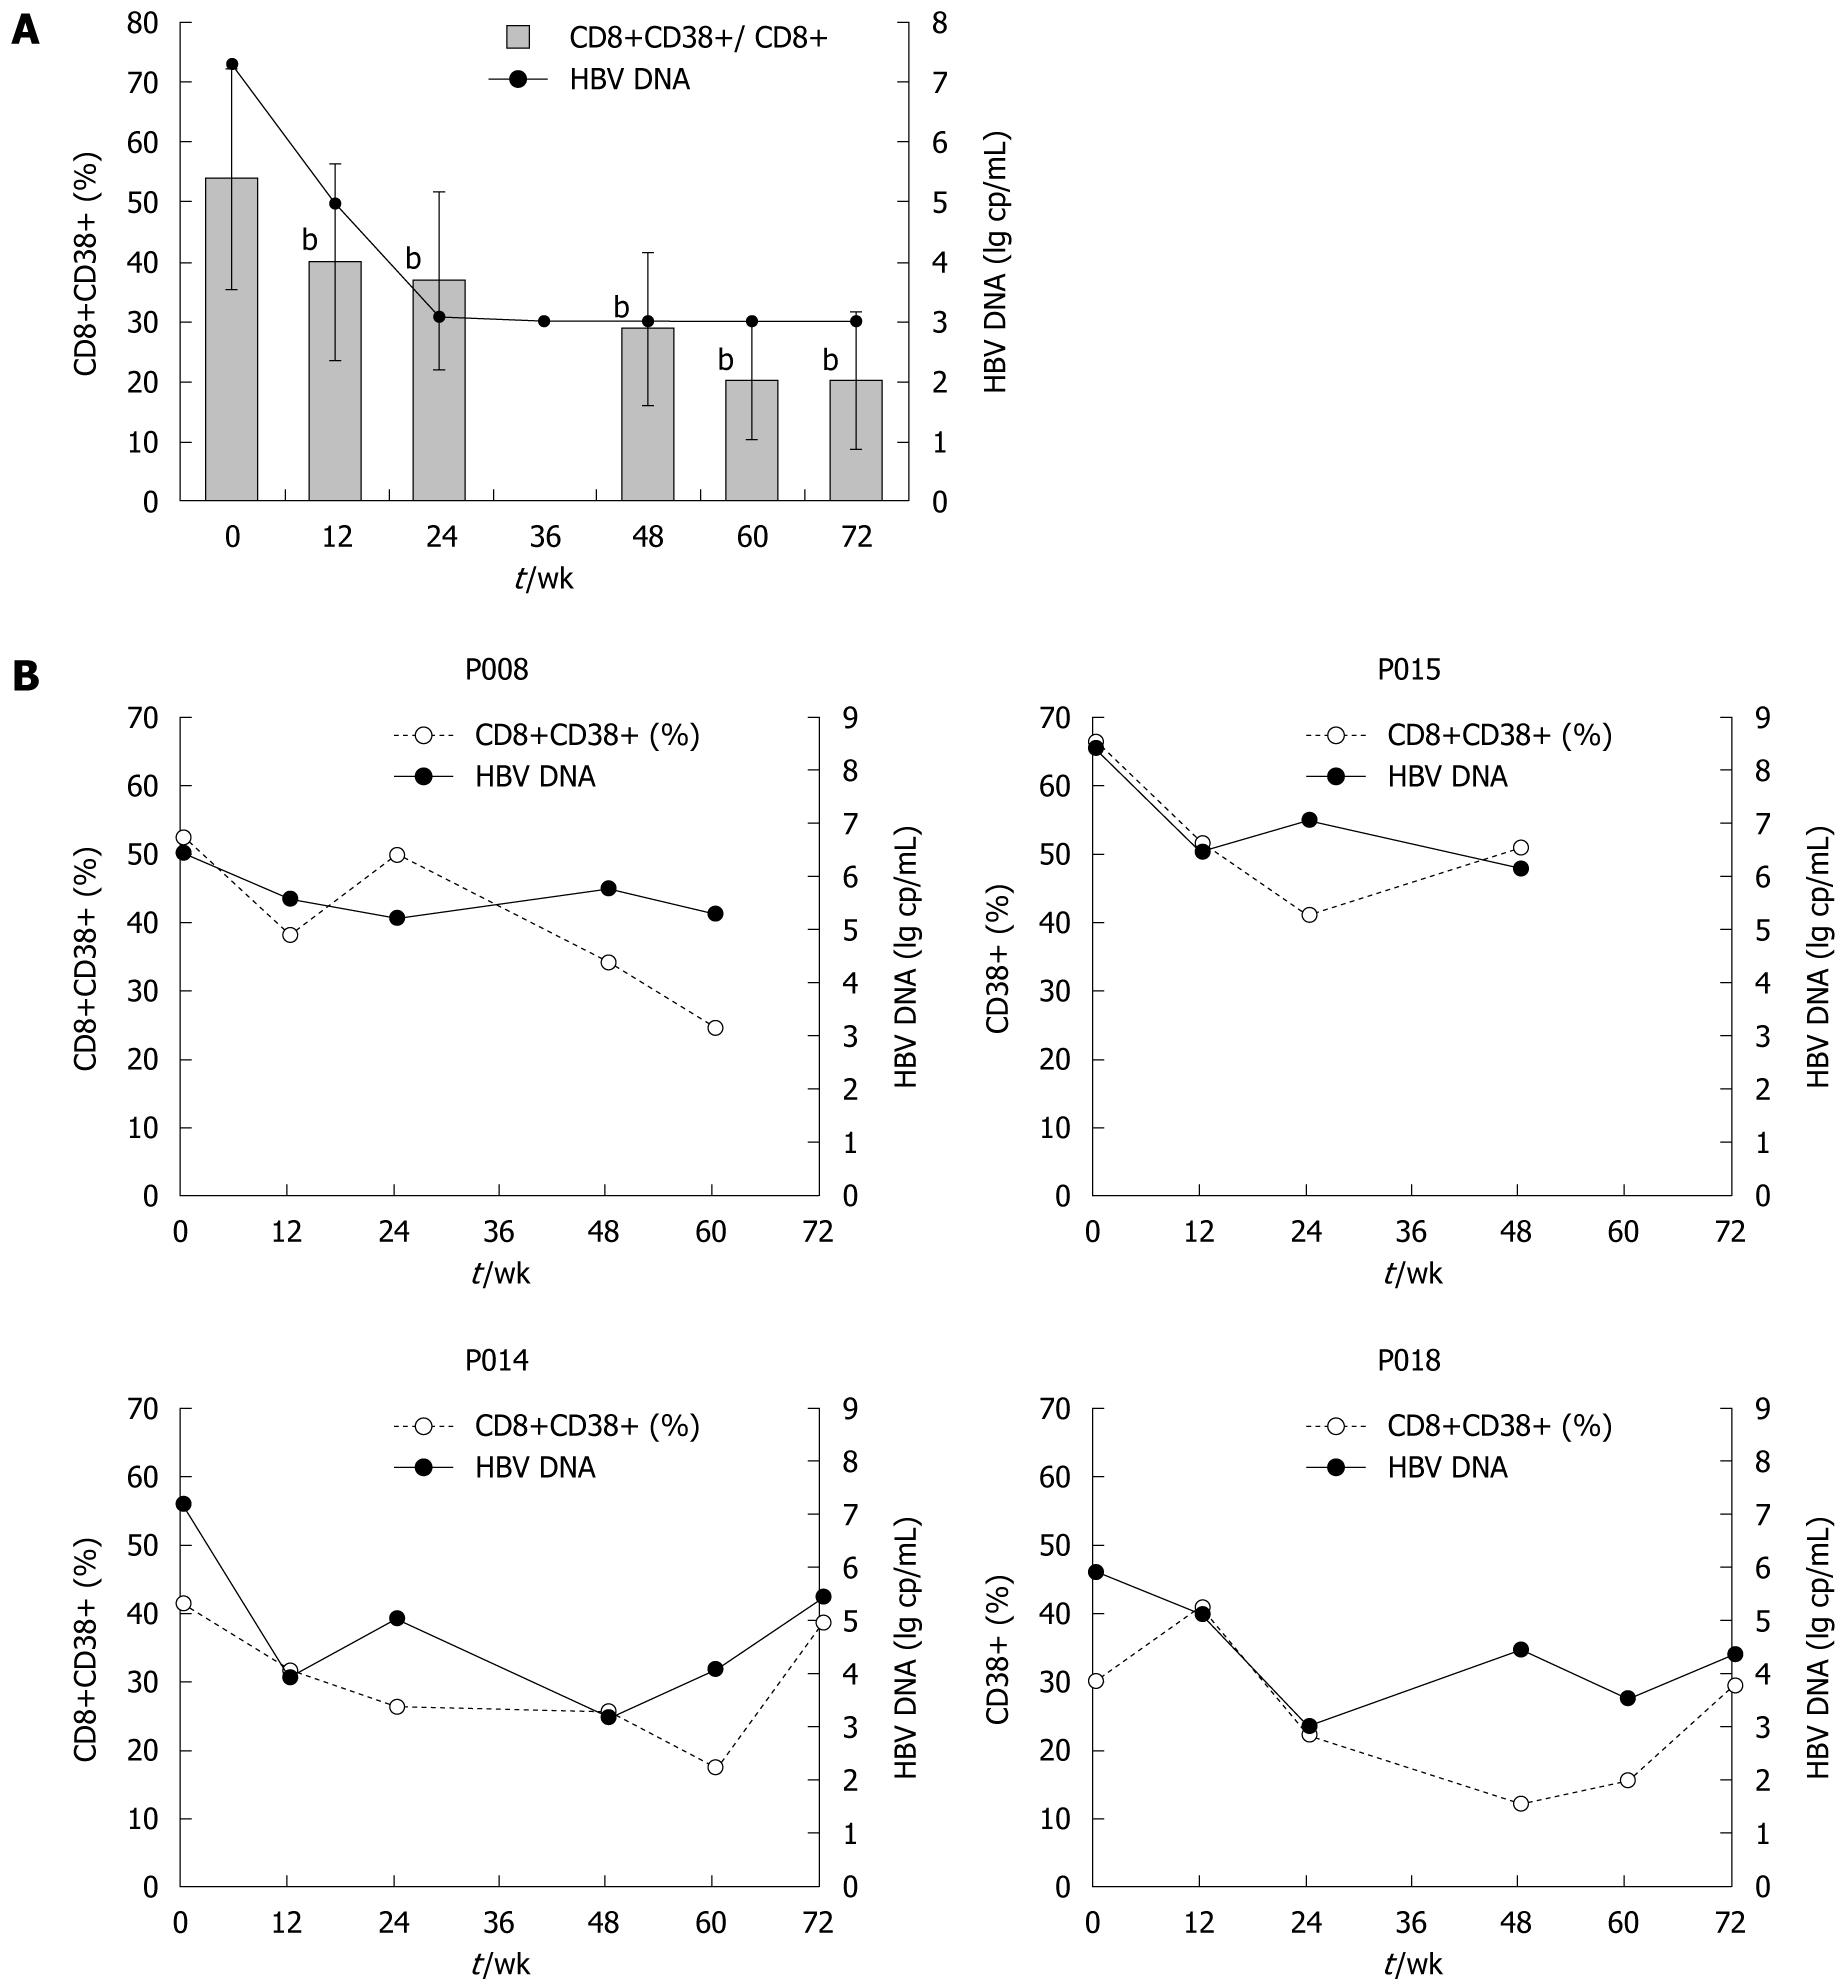
Figure 4 Changes of CD8+CD38+ T cell subsets and median hepatitis B virus DNA, by study week.
A: Median CD8+CD38+ T cell proportions in good responders. bP < 0.01; B: Changes of CD8+CD38+ T cell subsets in 4 non-responding patients 008, 014, 015, and 018. Among them, Patient 008 and 015 only finished 60 and 48 wk of treatment, respectively. Patient 014 and 018 completed 72 wk of treatment. HBV: Hepatitis B virus.
Figure 5 Correlations between CD8+CD38+ T cell levels and median hepatitis B virus DNA.
HBV: Hepatitis B virus. r = 0.438, P = 0.001.
- Citation: Cao W, Qiu ZF, Li TS. Parallel decline of CD8+CD38+ lymphocytes and viremia in treated hepatitis B patients. World J Gastroenterol 2011; 17(17): 2191-2198
- URL: https://www.wjgnet.com/1007-9327/full/v17/i17/2191.htm
- DOI: https://dx.doi.org/10.3748/wjg.v17.i17.2191


