Copyright
©2011 Baishideng Publishing Group Co.
World J Gastroenterol. Jan 7, 2011; 17(1): 89-97
Published online Jan 7, 2011. doi: 10.3748/wjg.v17.i1.89
Published online Jan 7, 2011. doi: 10.3748/wjg.v17.i1.89
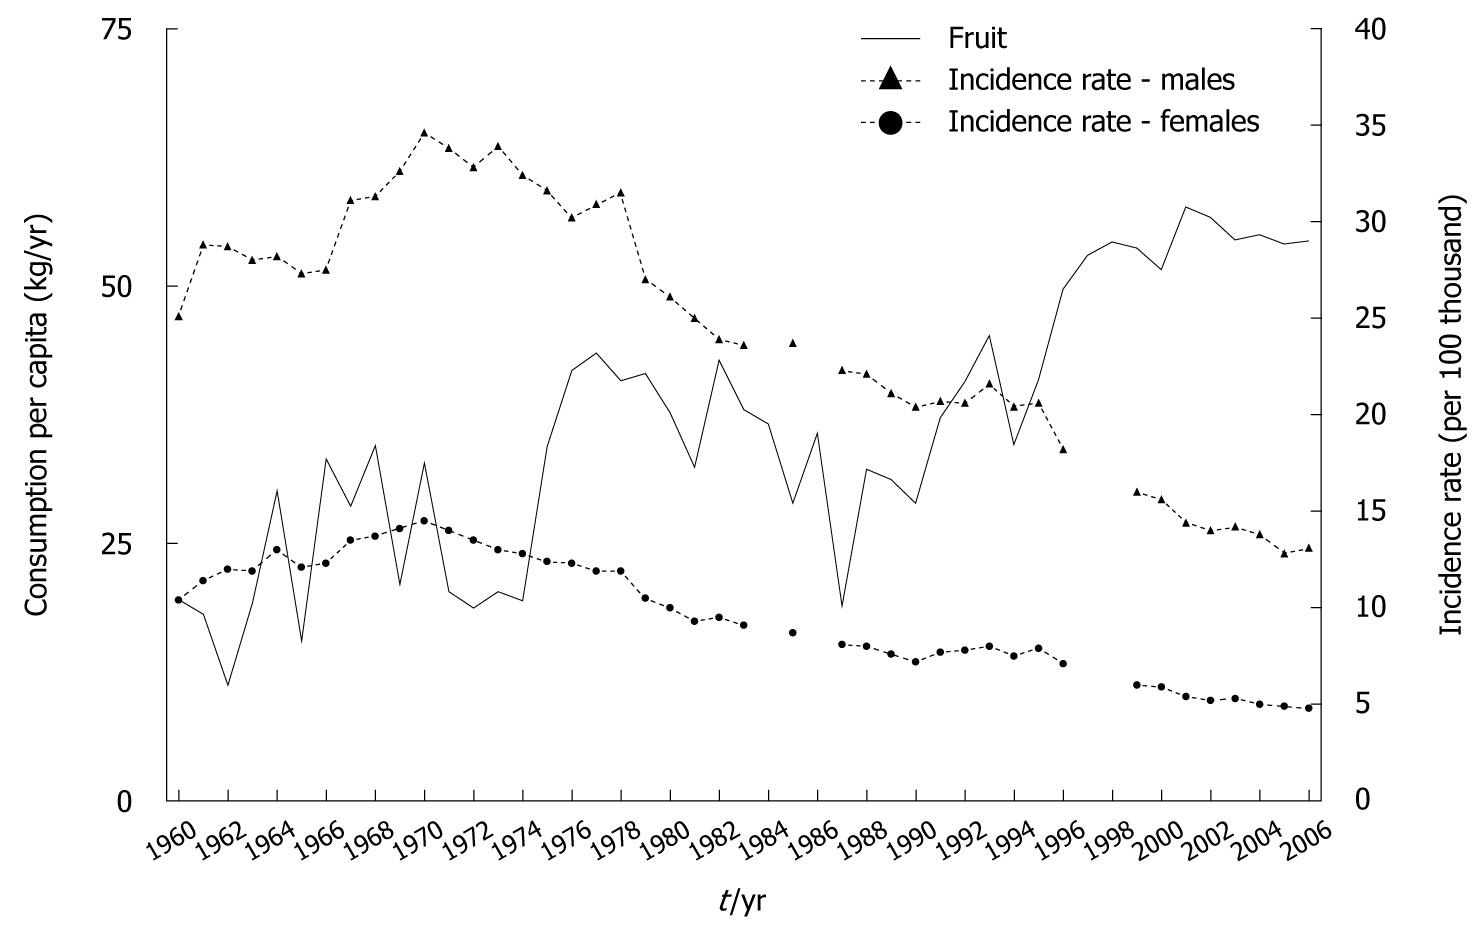
Figure 1 Fruit consumption and gastric cancer morbidity in 1960-2006.
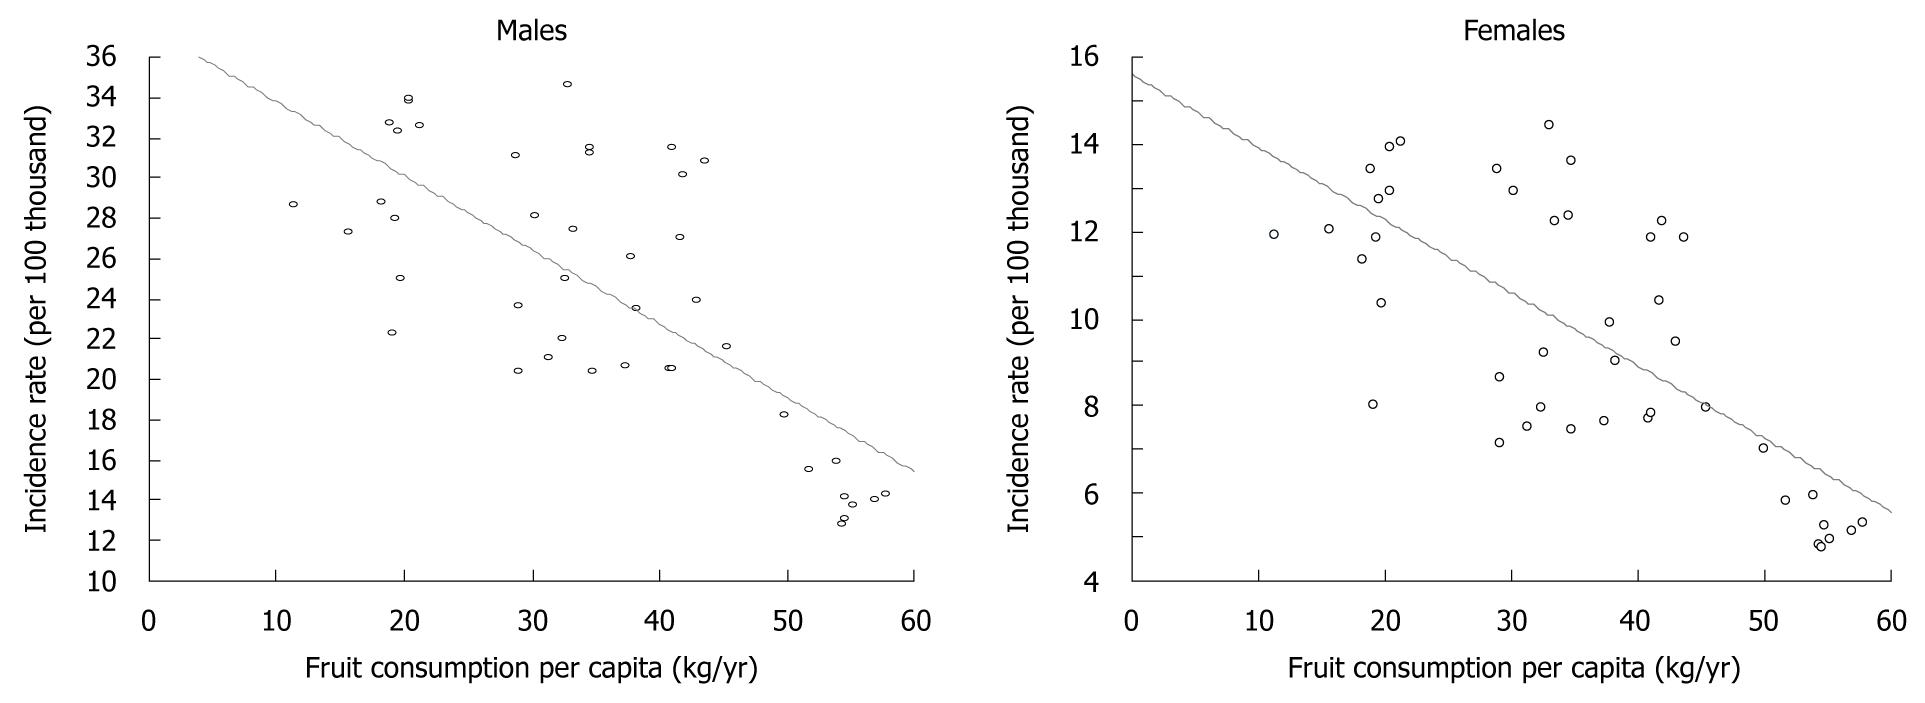
Figure 2 Correlation between fruit consumption and gastric cancer morbidity.
Spearman’s rank correlation coefficient (rs) for men: rs = -0.65 (P < 0.001), and for women: rs = -0.66 (P < 0.001).
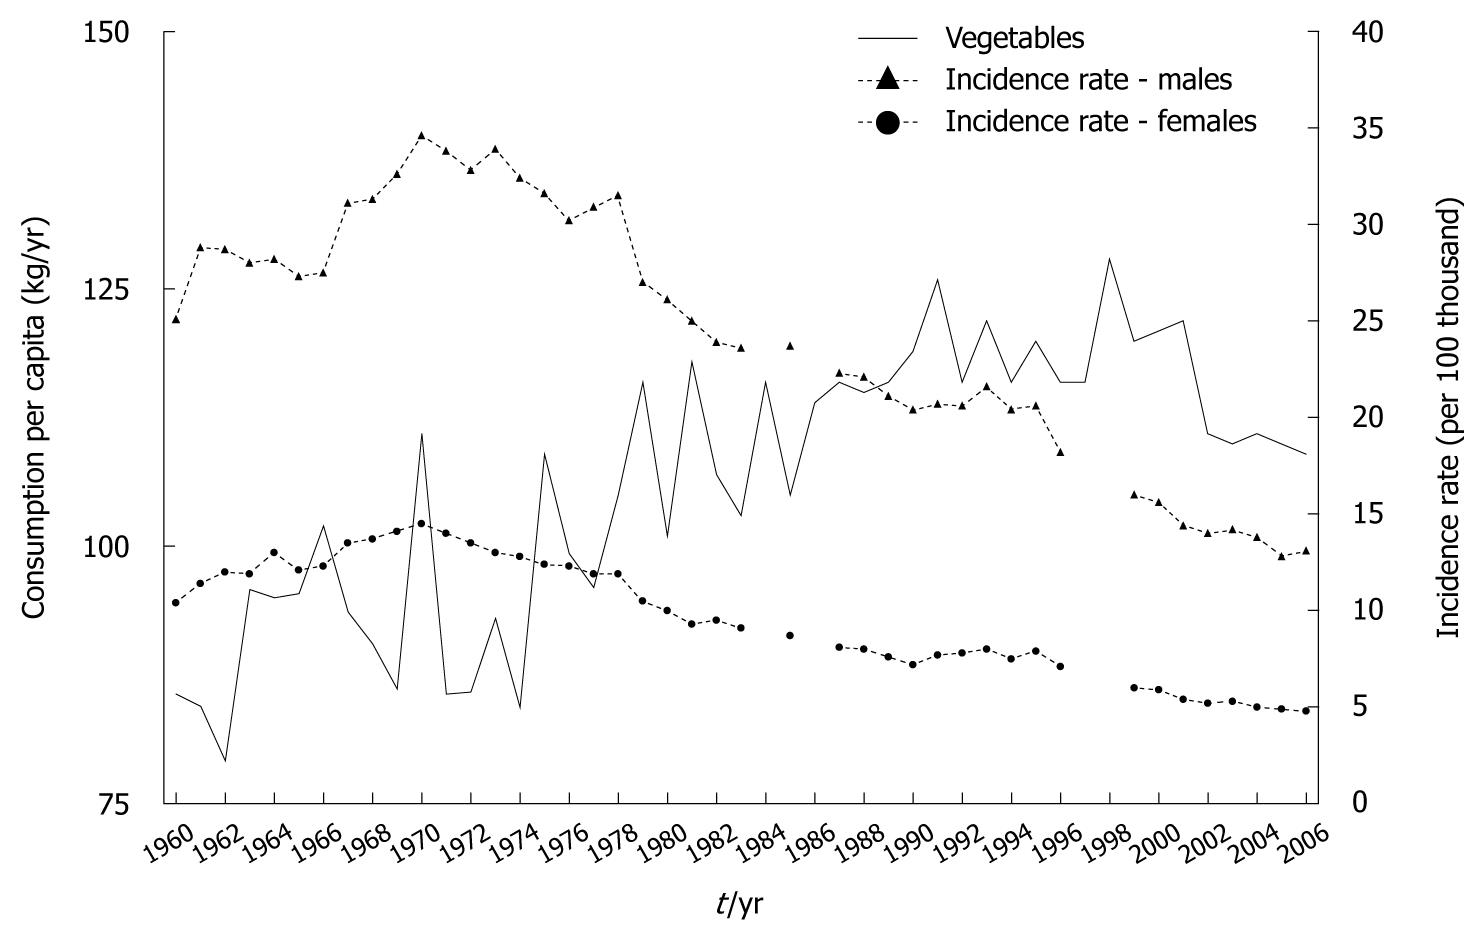
Figure 3 Vegetables consumption and gastric cancer morbidity in 1960-2006.
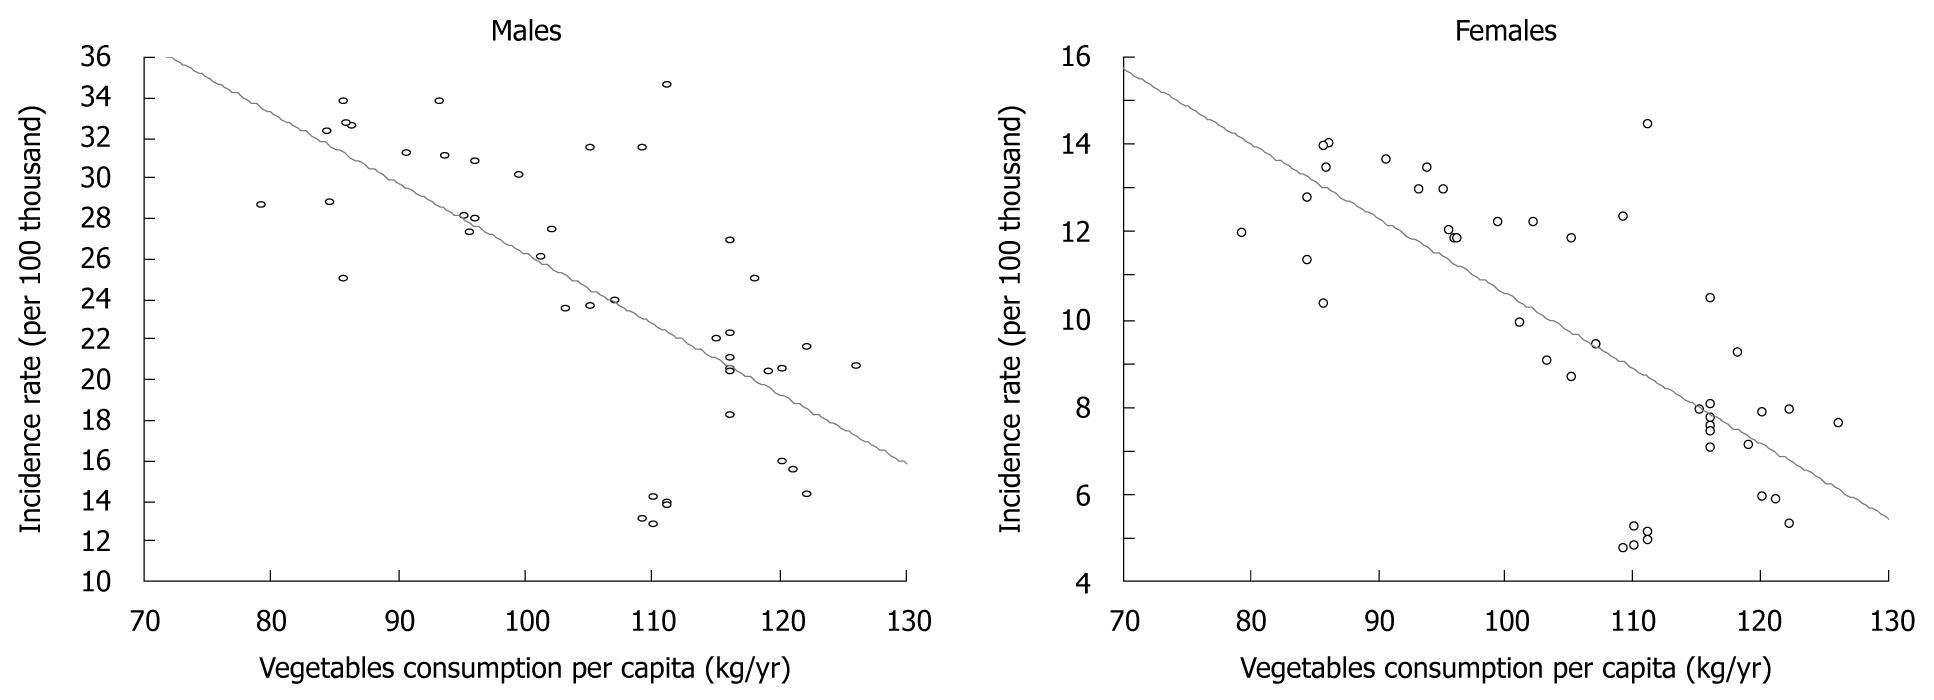
Figure 4 Correlation between vegetable consumption and gastric cancer morbidity.
Spearman’s rank correlation coefficient (rs) for men: rs = -0.70 (P < 0.001), and for women: rs = -0.70 (P < 0.001).
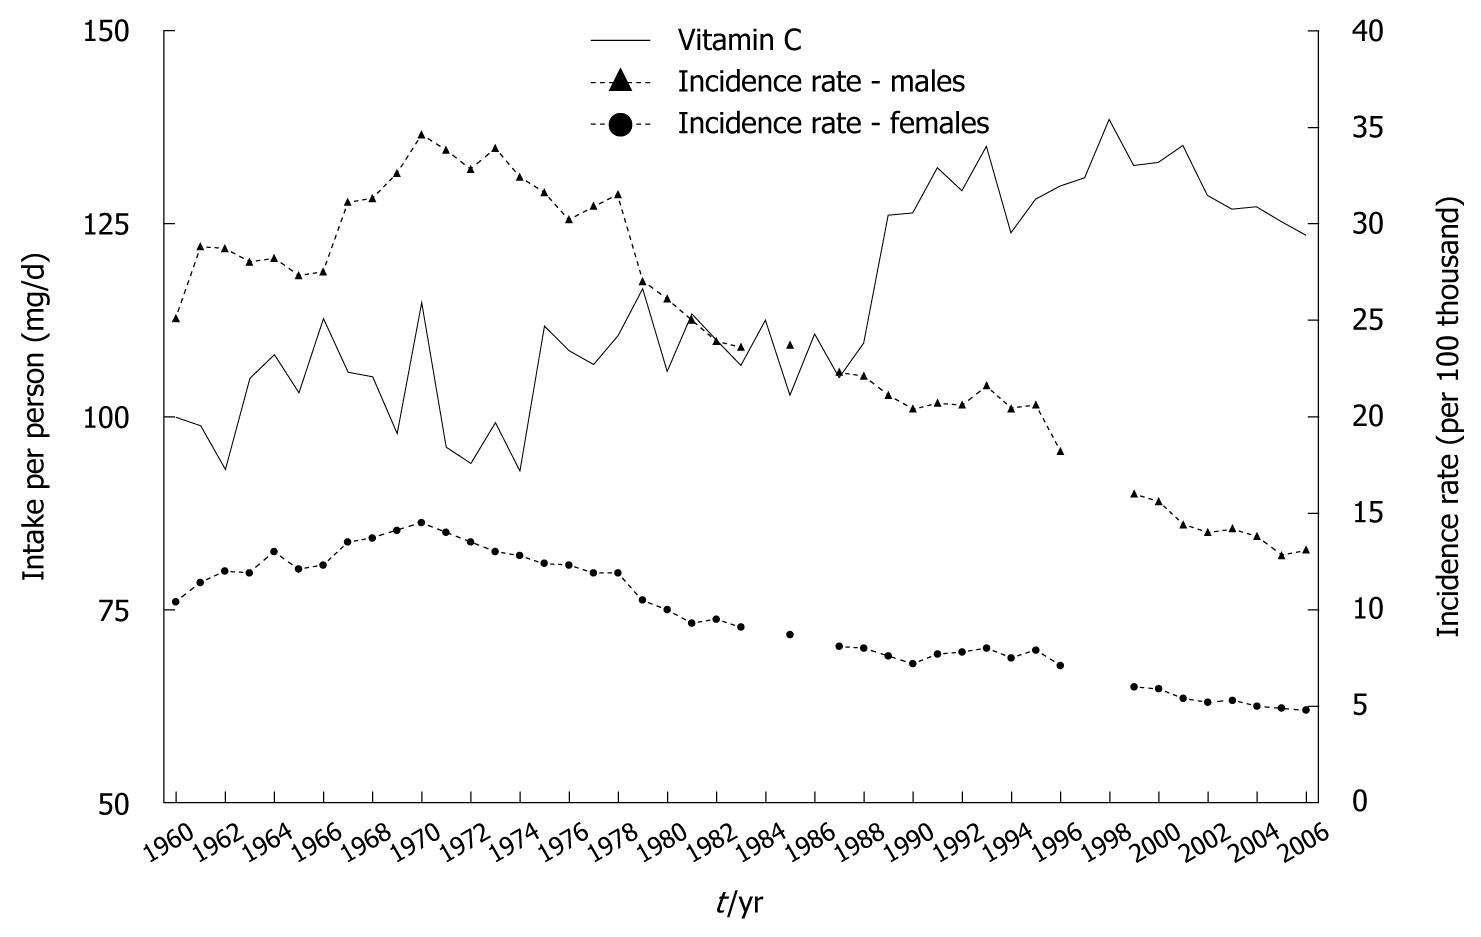
Figure 5 Vitamin C intake and gastric cancer morbidity in 1960-2006.
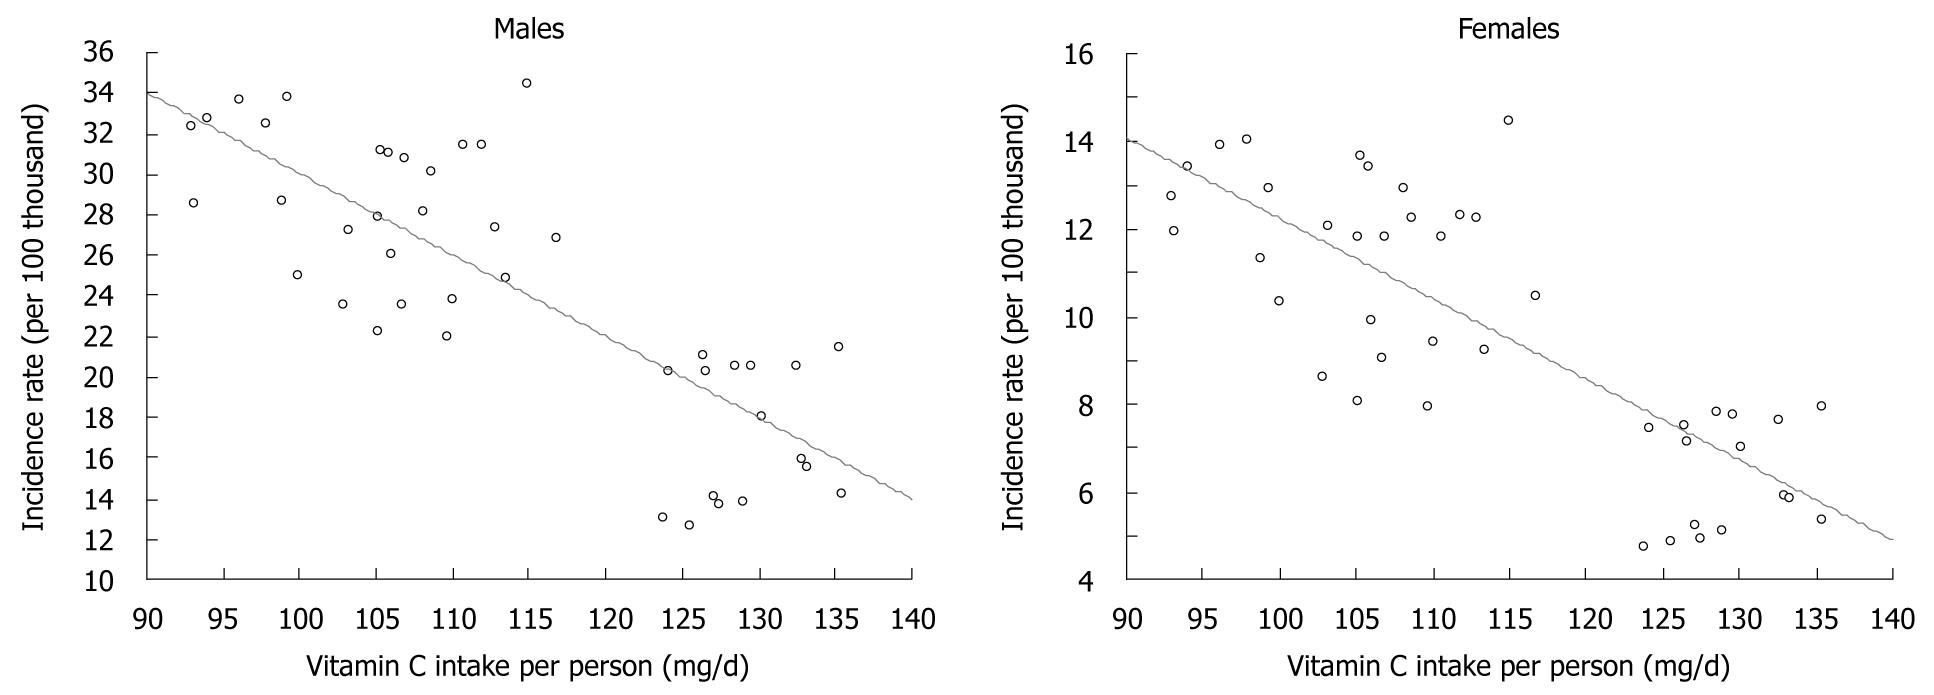
Figure 6 Correlation between vitamin C intake and gastric cancer morbidity.
Spearman’s rank correlation coefficient (rs) for men: rs = -0.75 (P < 0.001), and for women rs = -0.74 (P < 0.001).
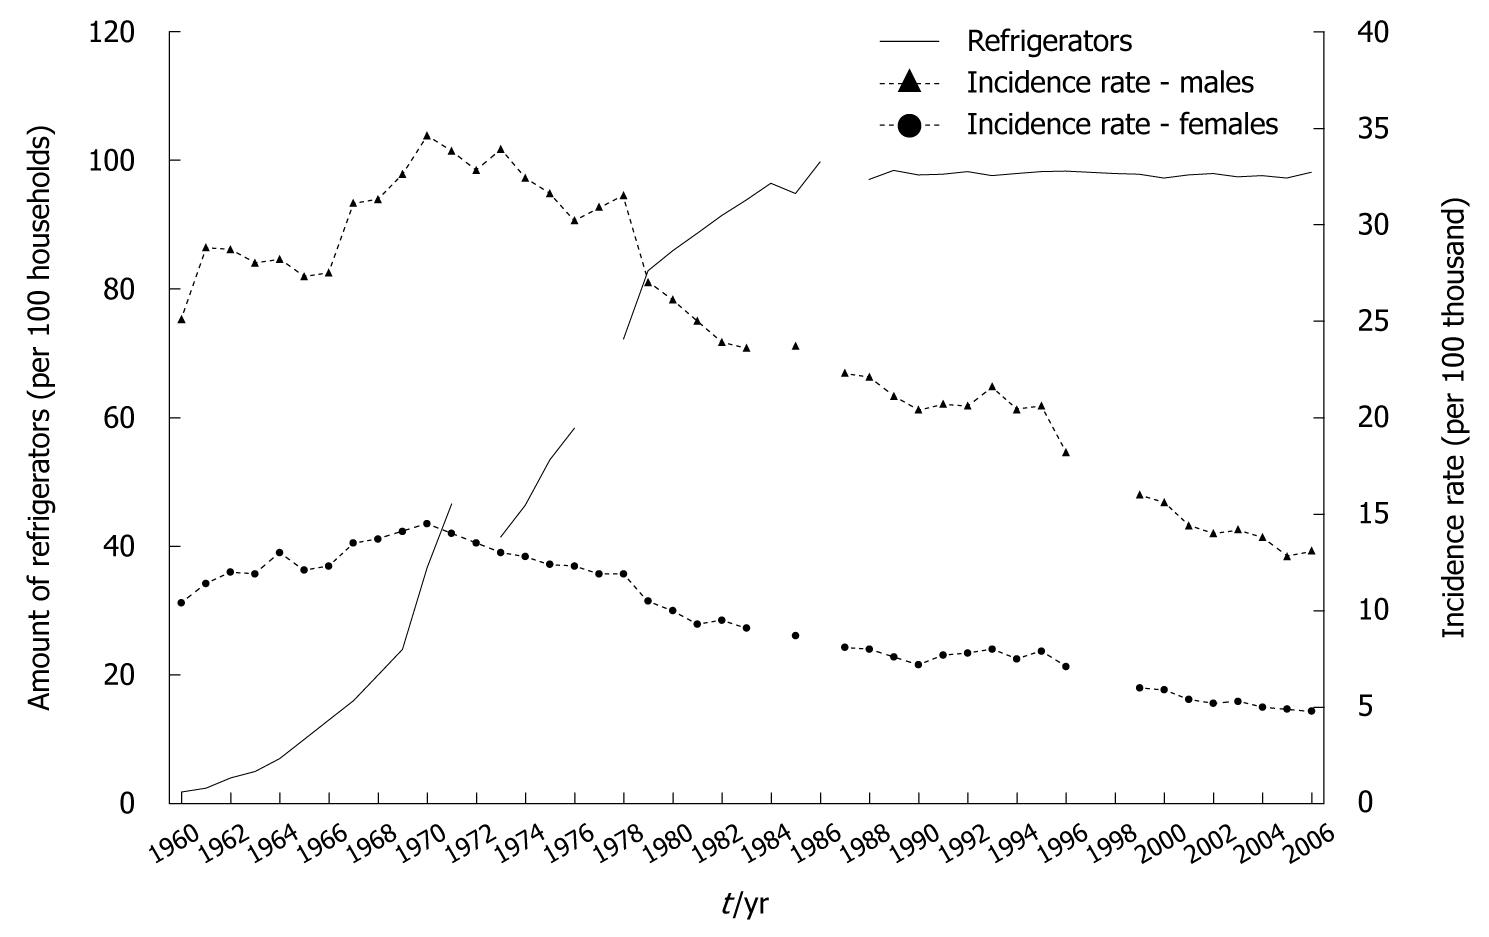
Figure 7 Equipment of households with refrigerators and gastric cancer morbidity in 1960-2006.
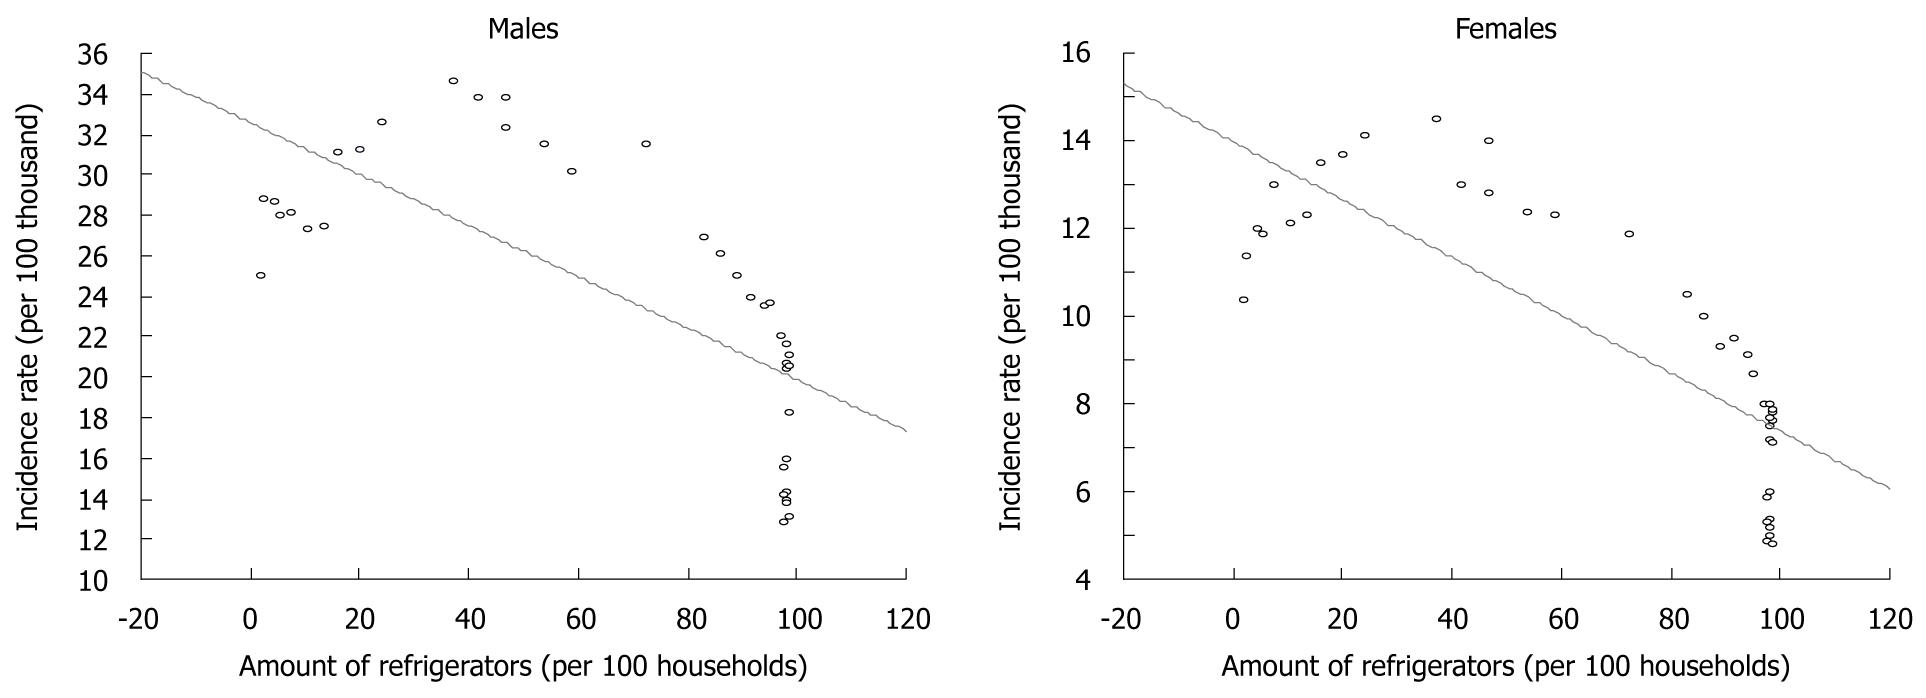
Figure 8 Correlation between equipment of households with refrigerators and gastric cancer morbidity.
Spearman’s rank correlation coefficient (rs) for men: rs = -0.77 (P < 0.001), and for women: rs = -0.80 (P < 0.001).
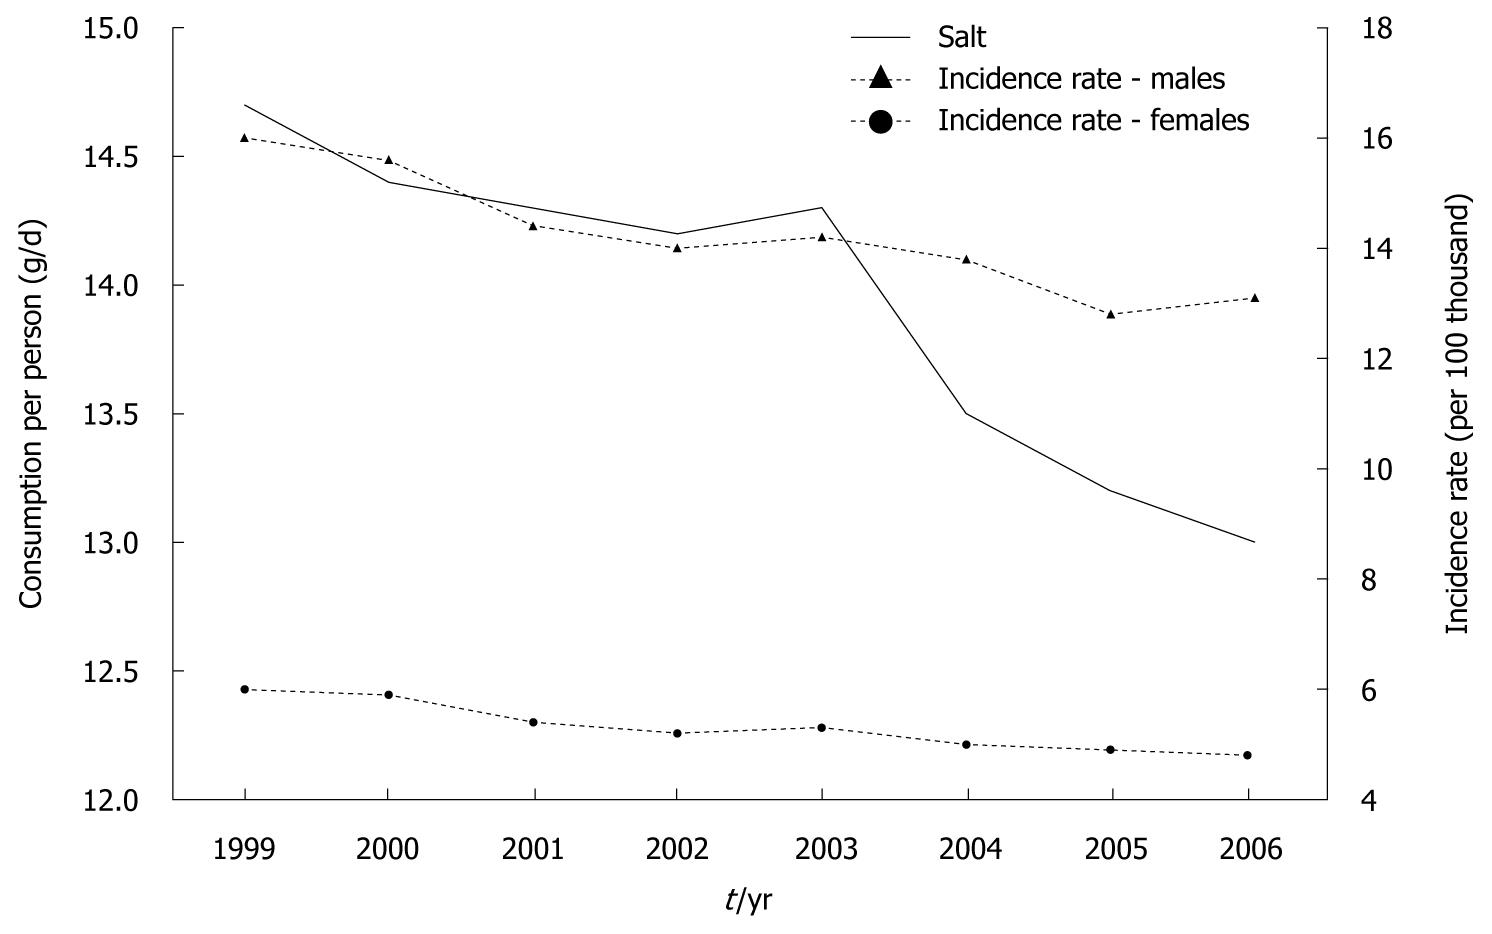
Figure 9 Total salt consumption and gastric cancer morbidity in 1999-2006.
Kitchen salt and salt calculated from sodium content in food products.
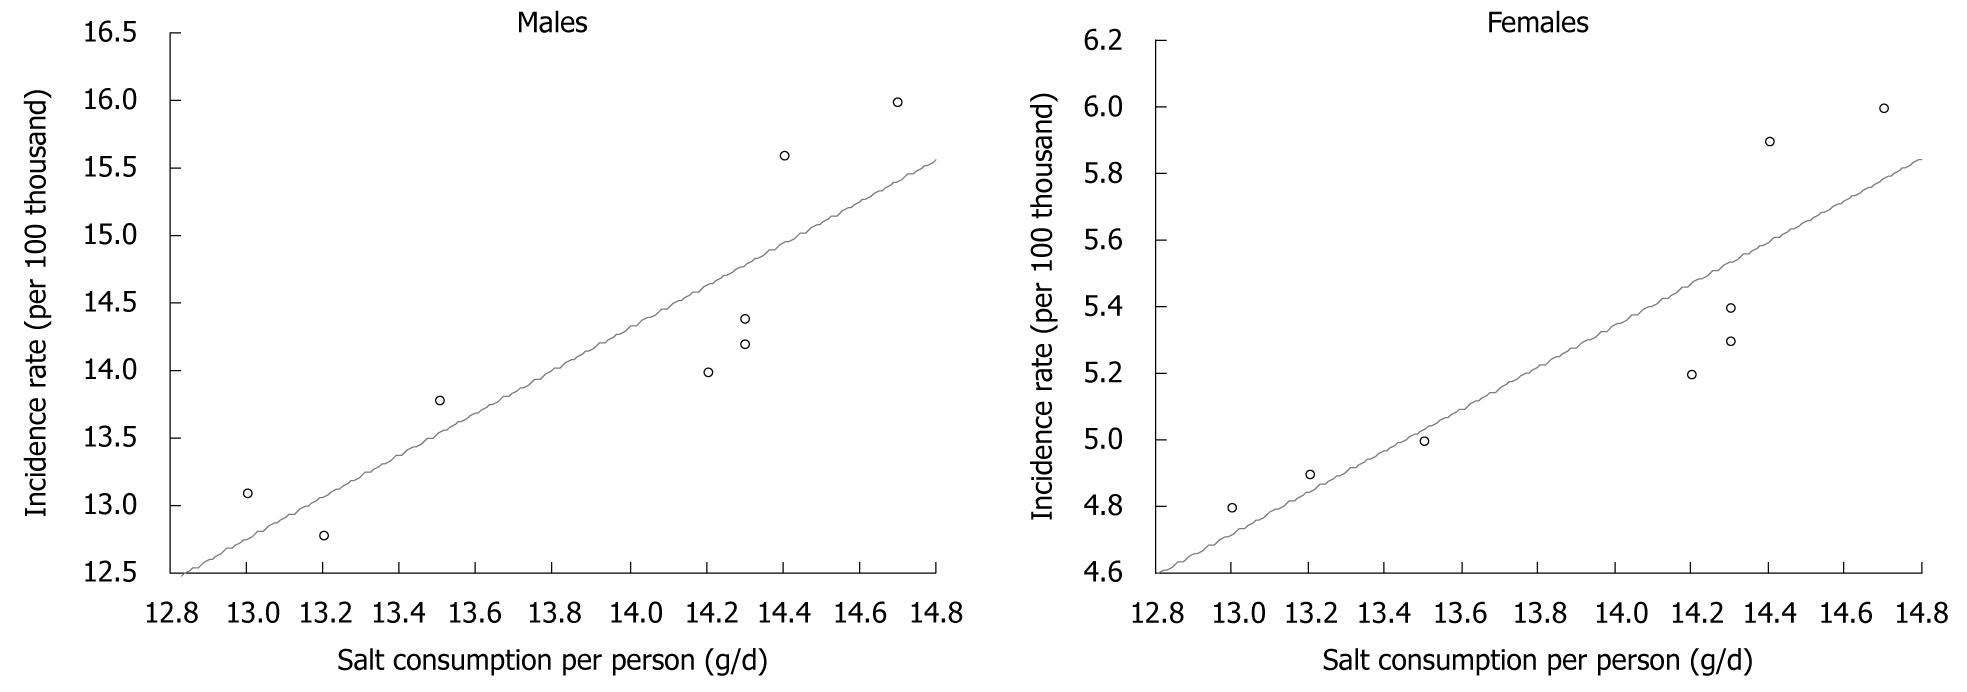
Figure 10 Correlation between total salt consumption and gastric cancer morbidity.
Spearman’s rank correlation coefficient (rs) for men: rs = 0.97 (P < 0.001), and for women: rs = 0.99 (P < 0.001). Kitchen salt and salt calculated from sodium content in food products.
- Citation: Jarosz M, Sekuła W, Rychlik E, Figurska K. Impact of diet on long-term decline in gastric cancer incidence in Poland. World J Gastroenterol 2011; 17(1): 89-97
- URL: https://www.wjgnet.com/1007-9327/full/v17/i1/89.htm
- DOI: https://dx.doi.org/10.3748/wjg.v17.i1.89


