Copyright
©2010 Baishideng.
World J Gastroenterol. Mar 7, 2010; 16(9): 1138-1149
Published online Mar 7, 2010. doi: 10.3748/wjg.v16.i9.1138
Published online Mar 7, 2010. doi: 10.3748/wjg.v16.i9.1138
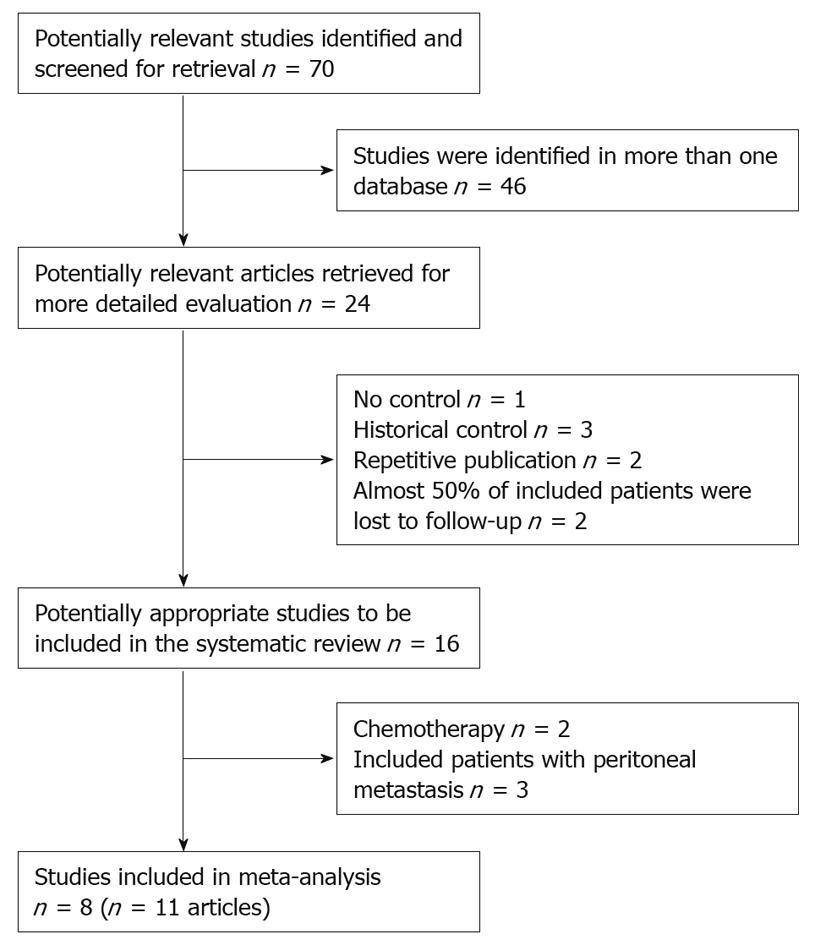
Figure 1 QUORUM flow chart for studies.
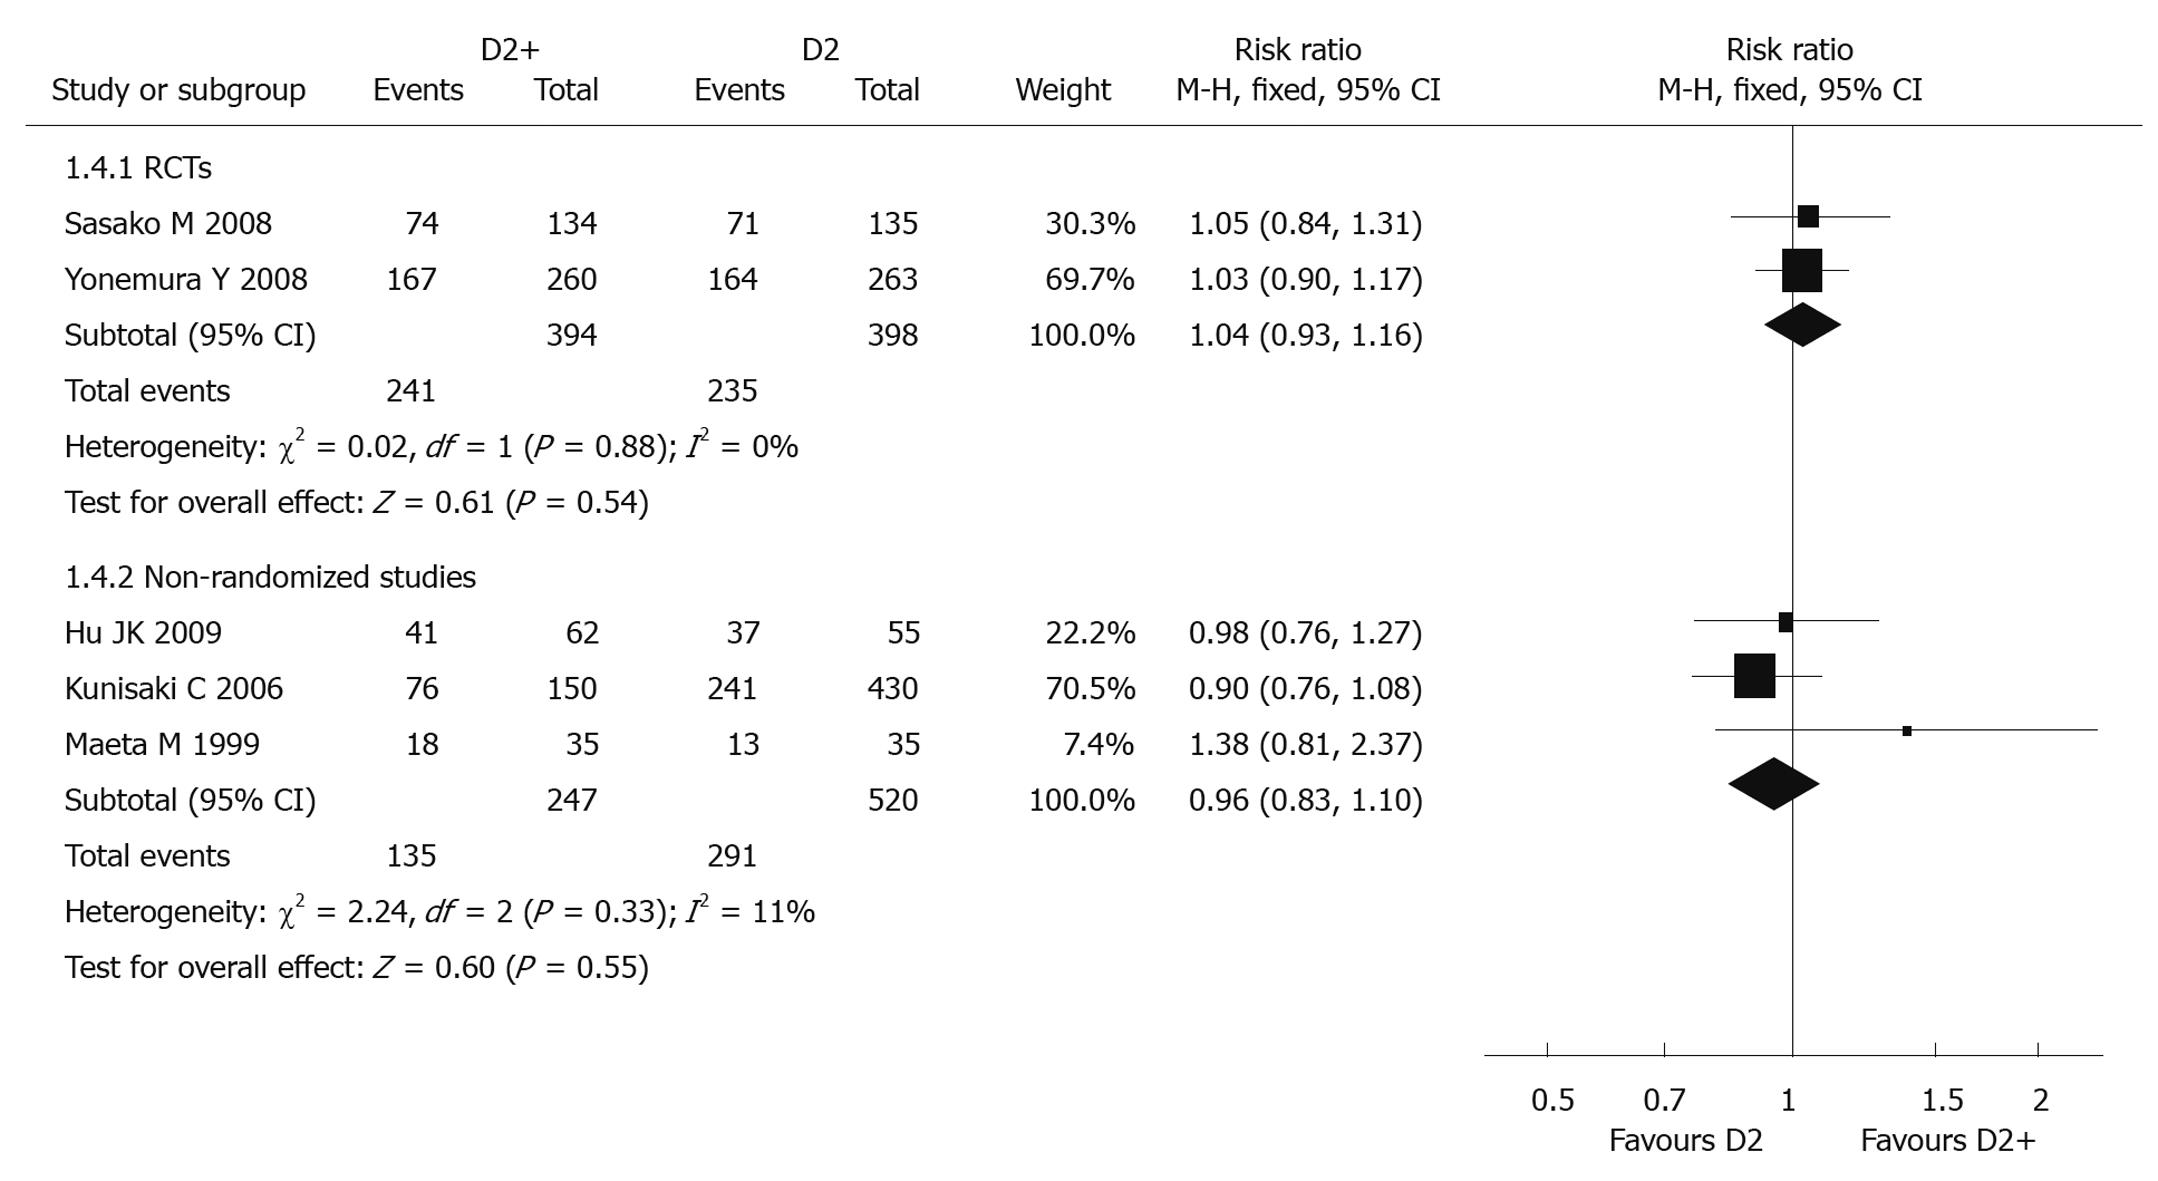
Figure 2 Meta-analysis of 5-year overall survival rate comparing D2 + PAND with D2 gastrectomy.
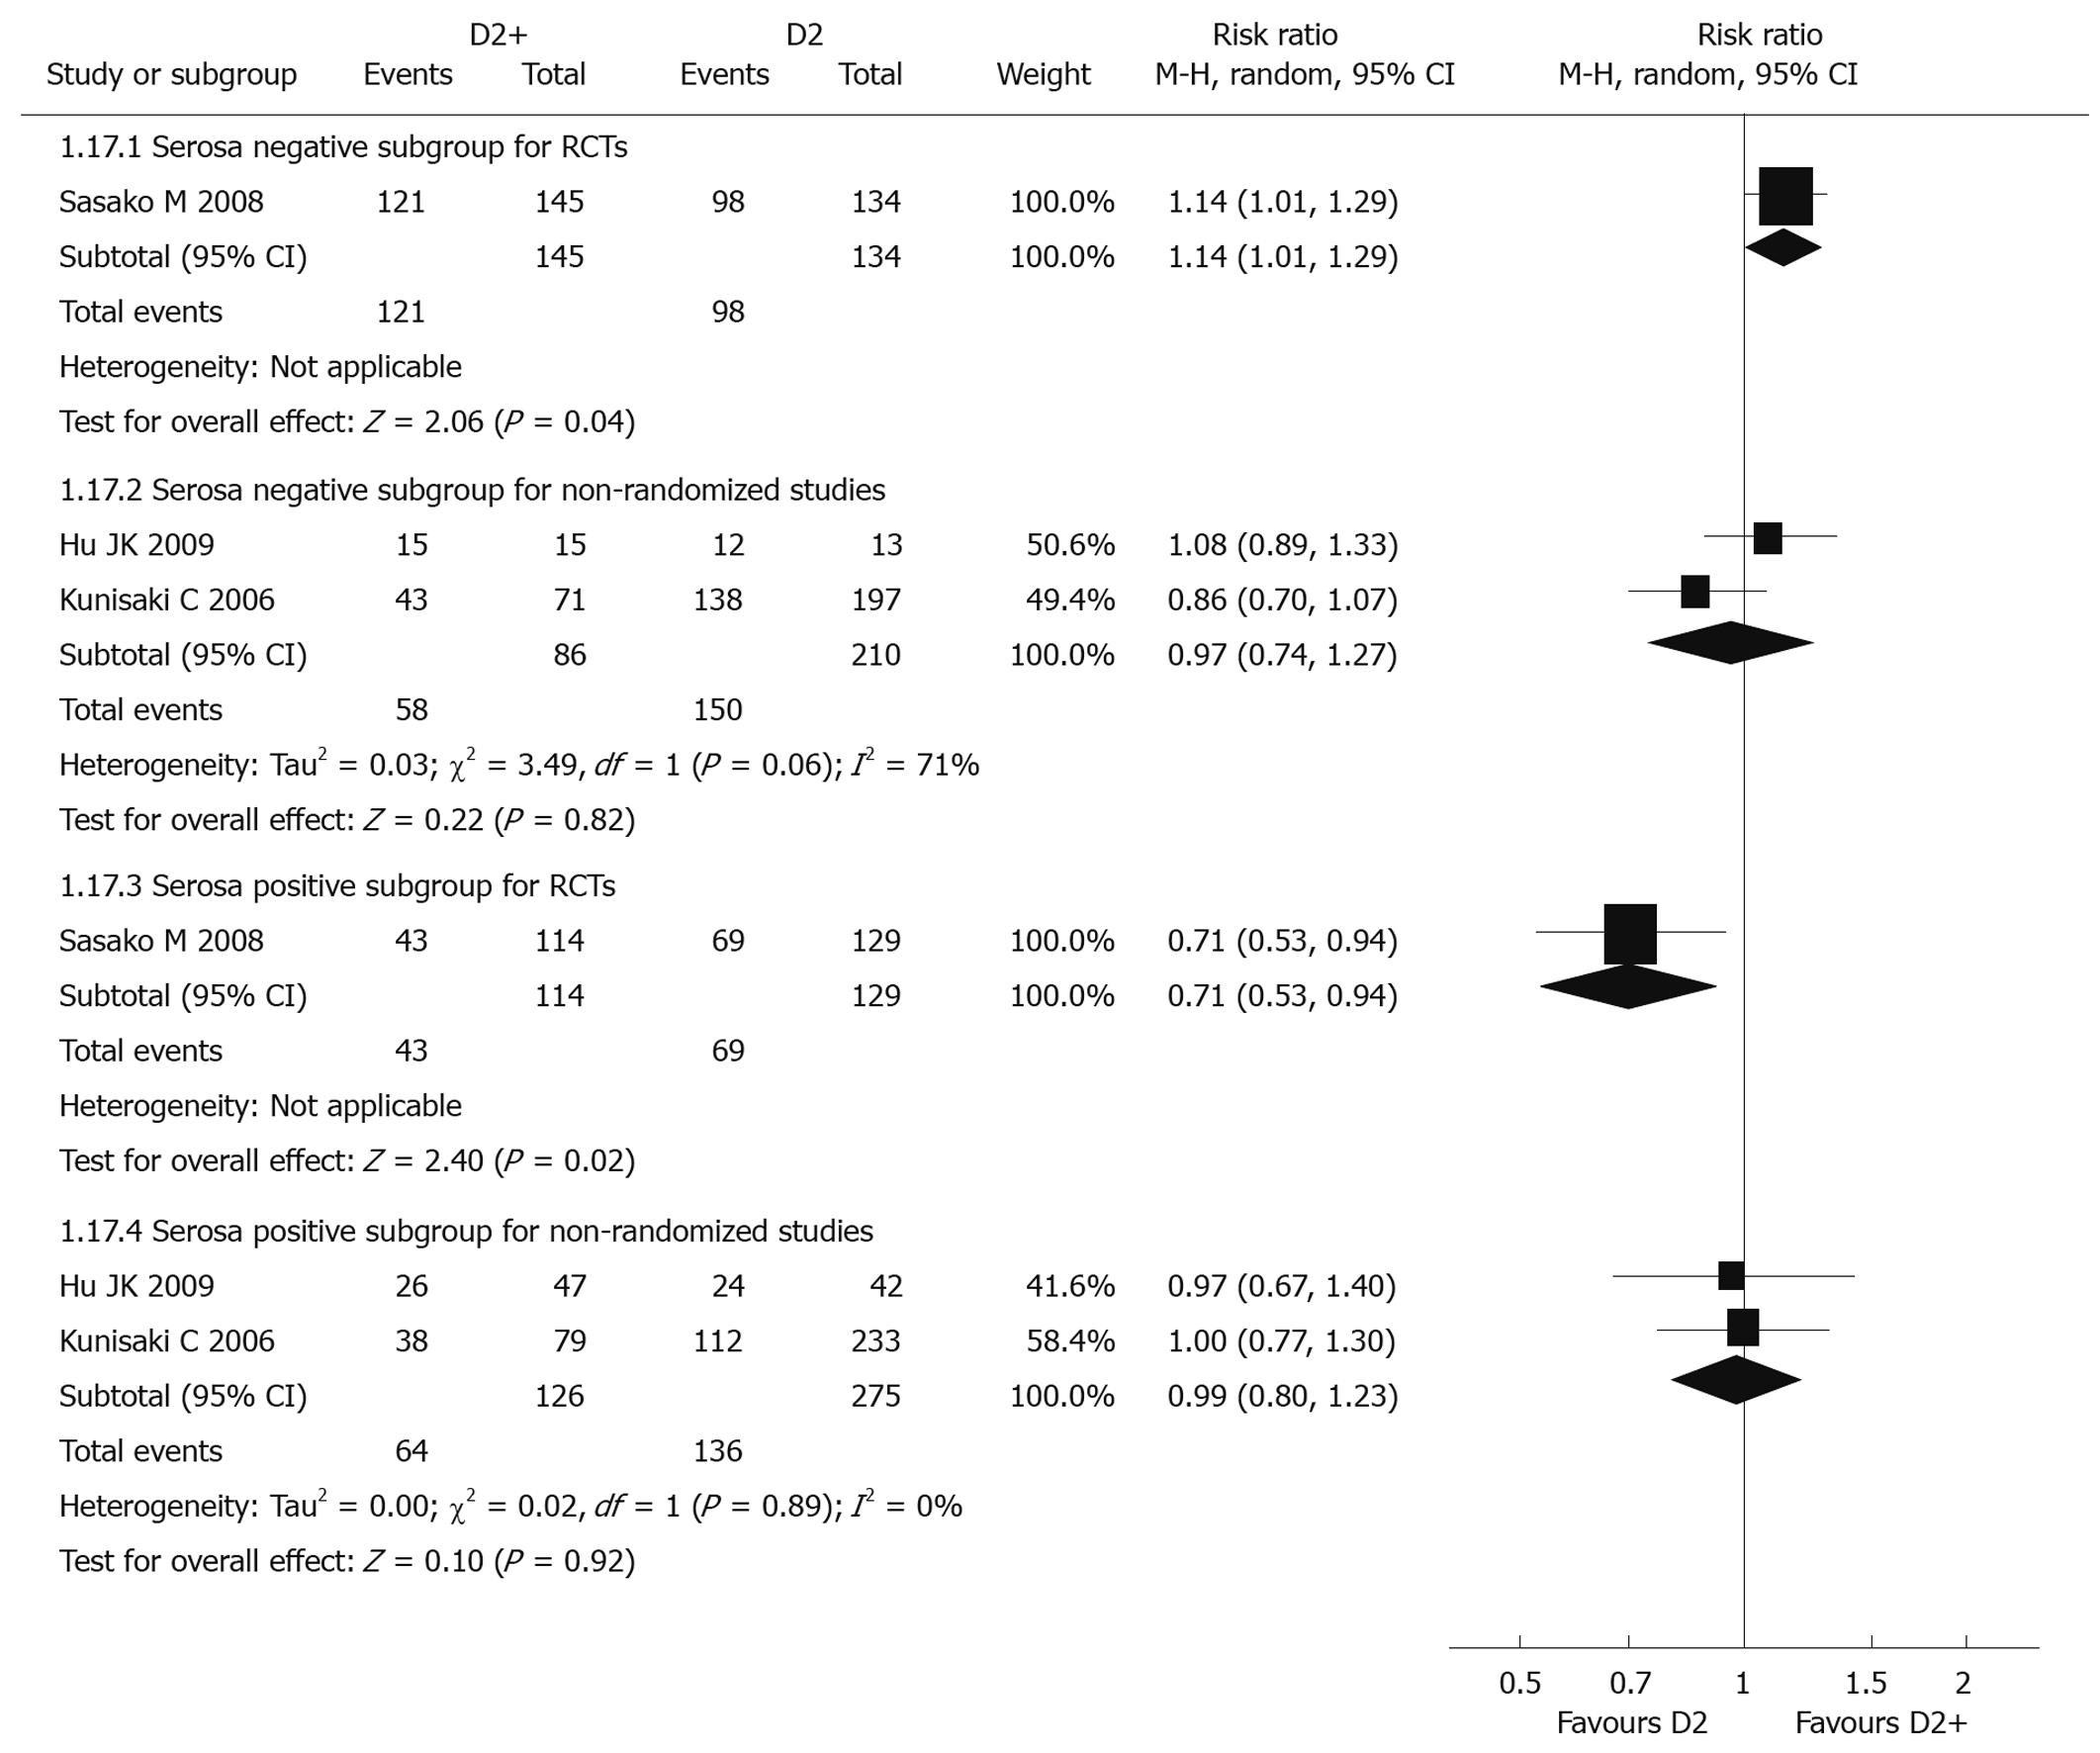
Figure 3 Meta-analysis of 5-year overall survival rate for serosa negative and positive subgroups comparing D2 + PAND with D2 gastrectomy.
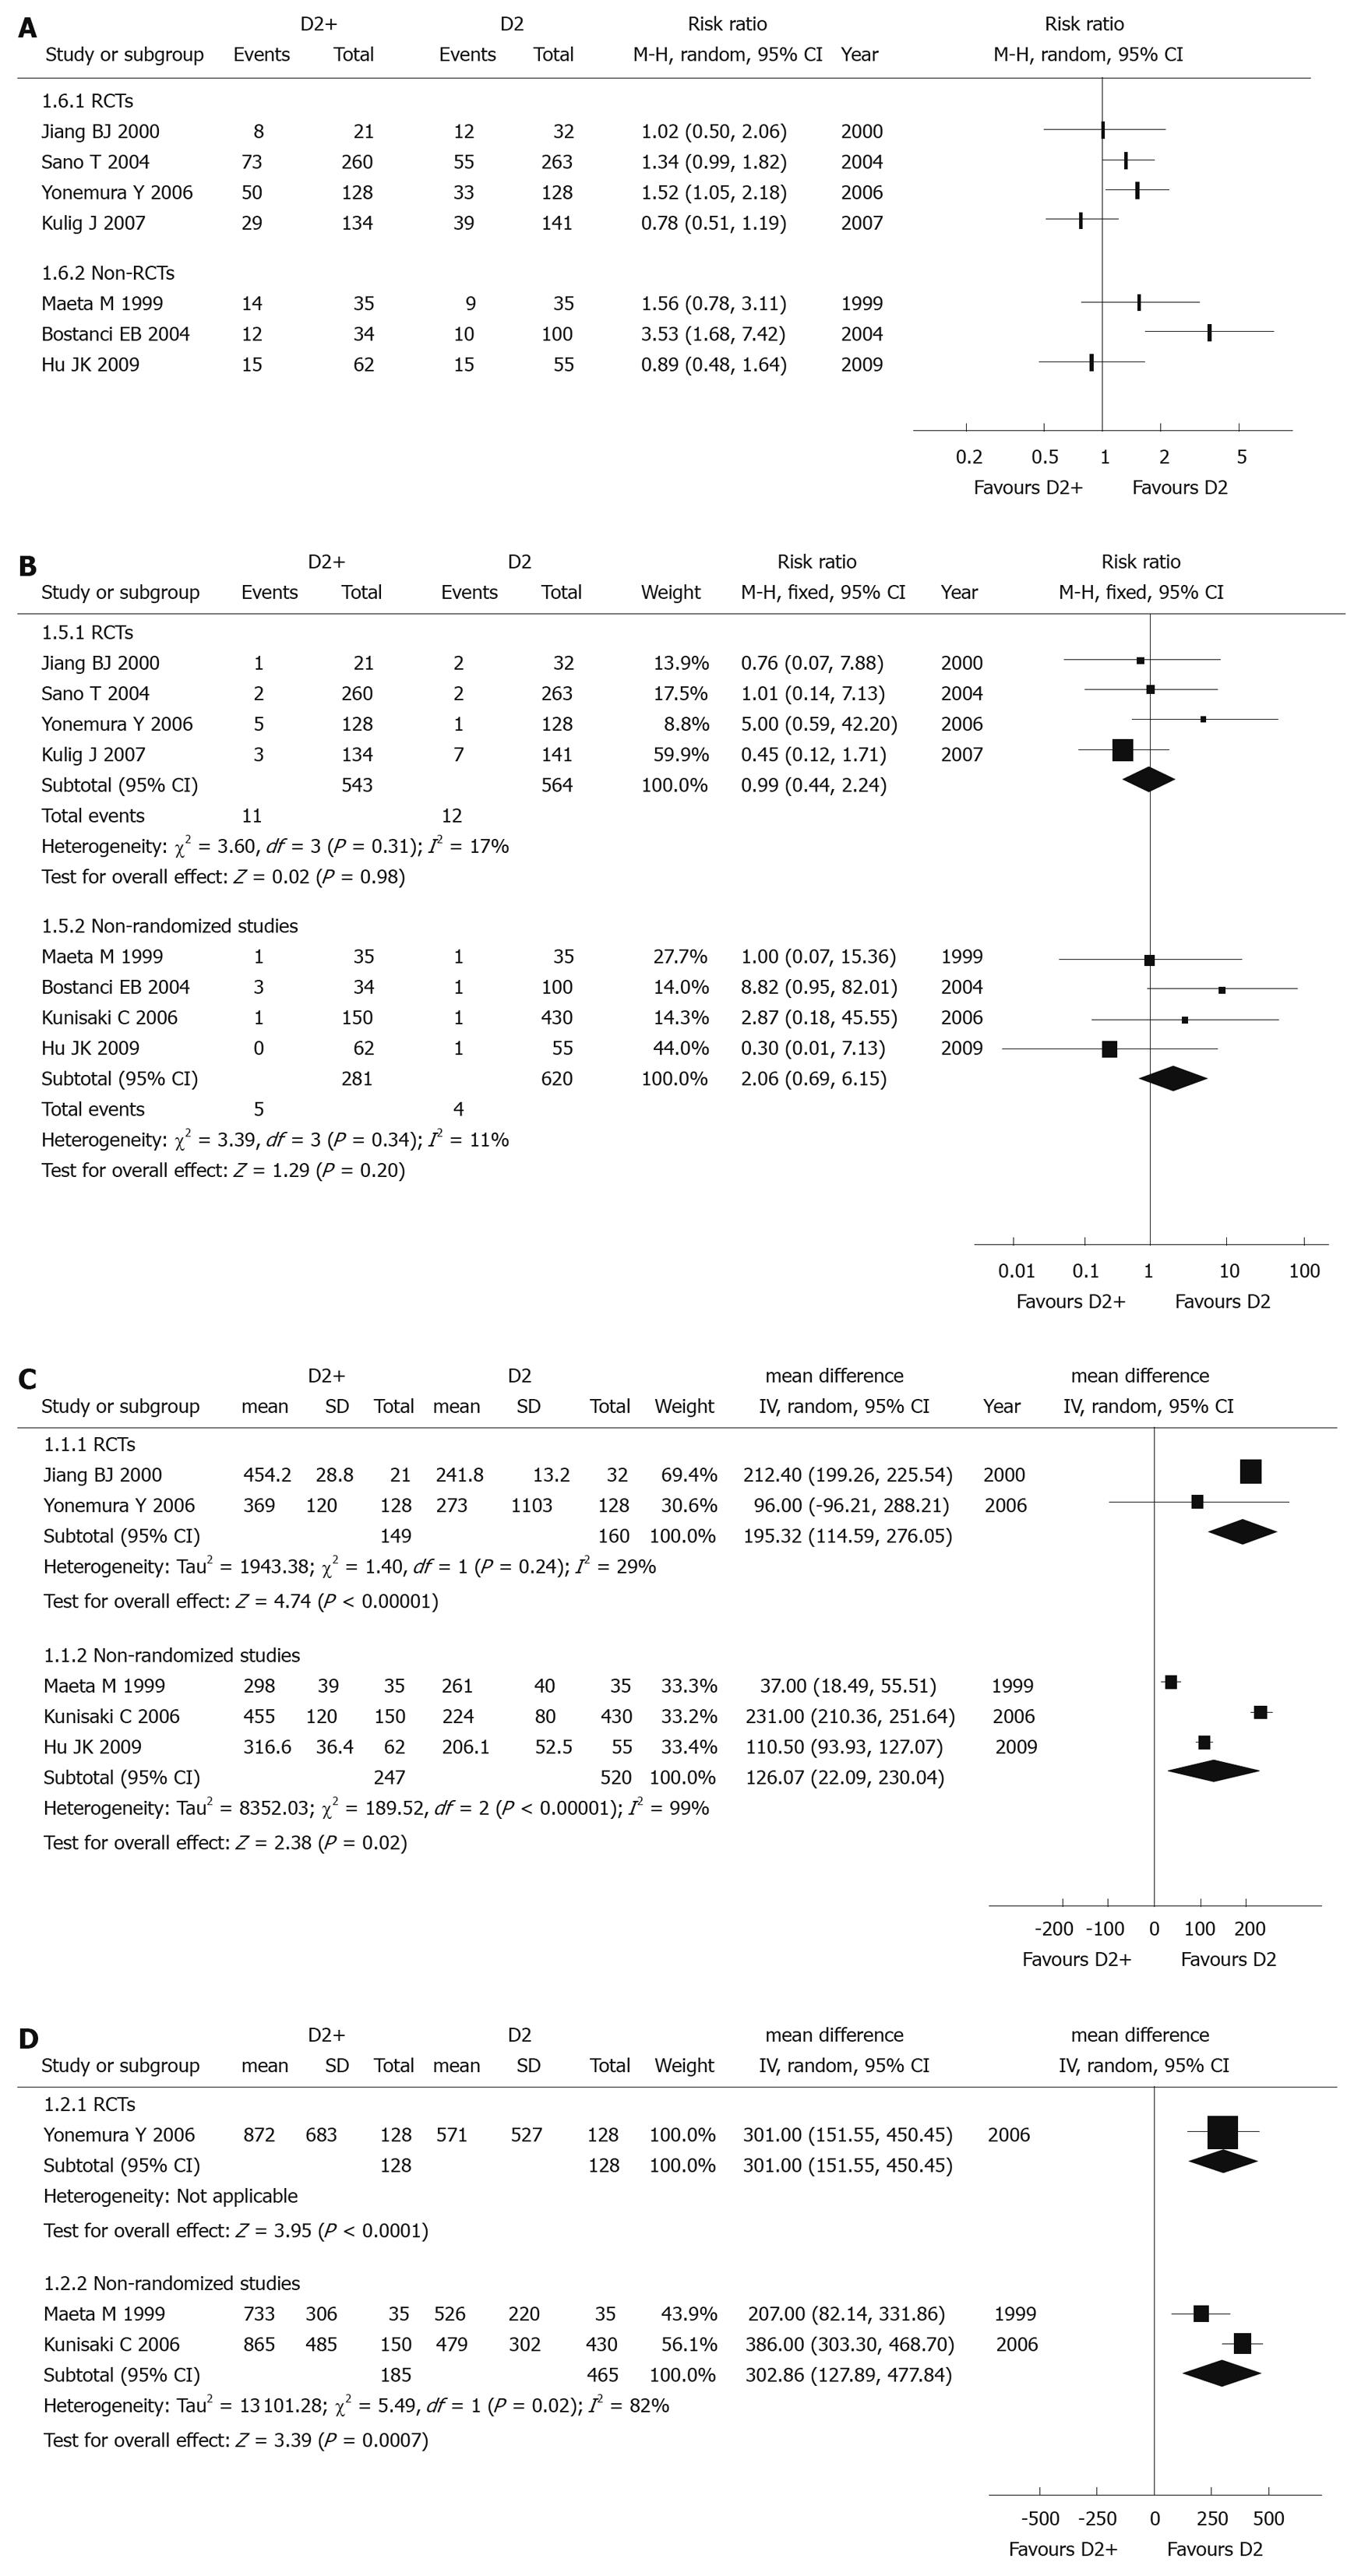
Figure 4 Meta-analysis of post-operative morbidity comparing (A), post-operative mortality (B), operation time (C), blood loss during operation (D) D2 + PAND with D2 gastrectomy.
-
Citation: Wang Z, Chen JQ, Cao YF. Systematic review of D2 lymphadenectomy
versus D2 with para-aortic nodal dissection for advanced gastric cancer. World J Gastroenterol 2010; 16(9): 1138-1149 - URL: https://www.wjgnet.com/1007-9327/full/v16/i9/1138.htm
- DOI: https://dx.doi.org/10.3748/wjg.v16.i9.1138


