Copyright
©2010 Baishideng.
World J Gastroenterol. Feb 14, 2010; 16(6): 770-777
Published online Feb 14, 2010. doi: 10.3748/wjg.v16.i6.770
Published online Feb 14, 2010. doi: 10.3748/wjg.v16.i6.770
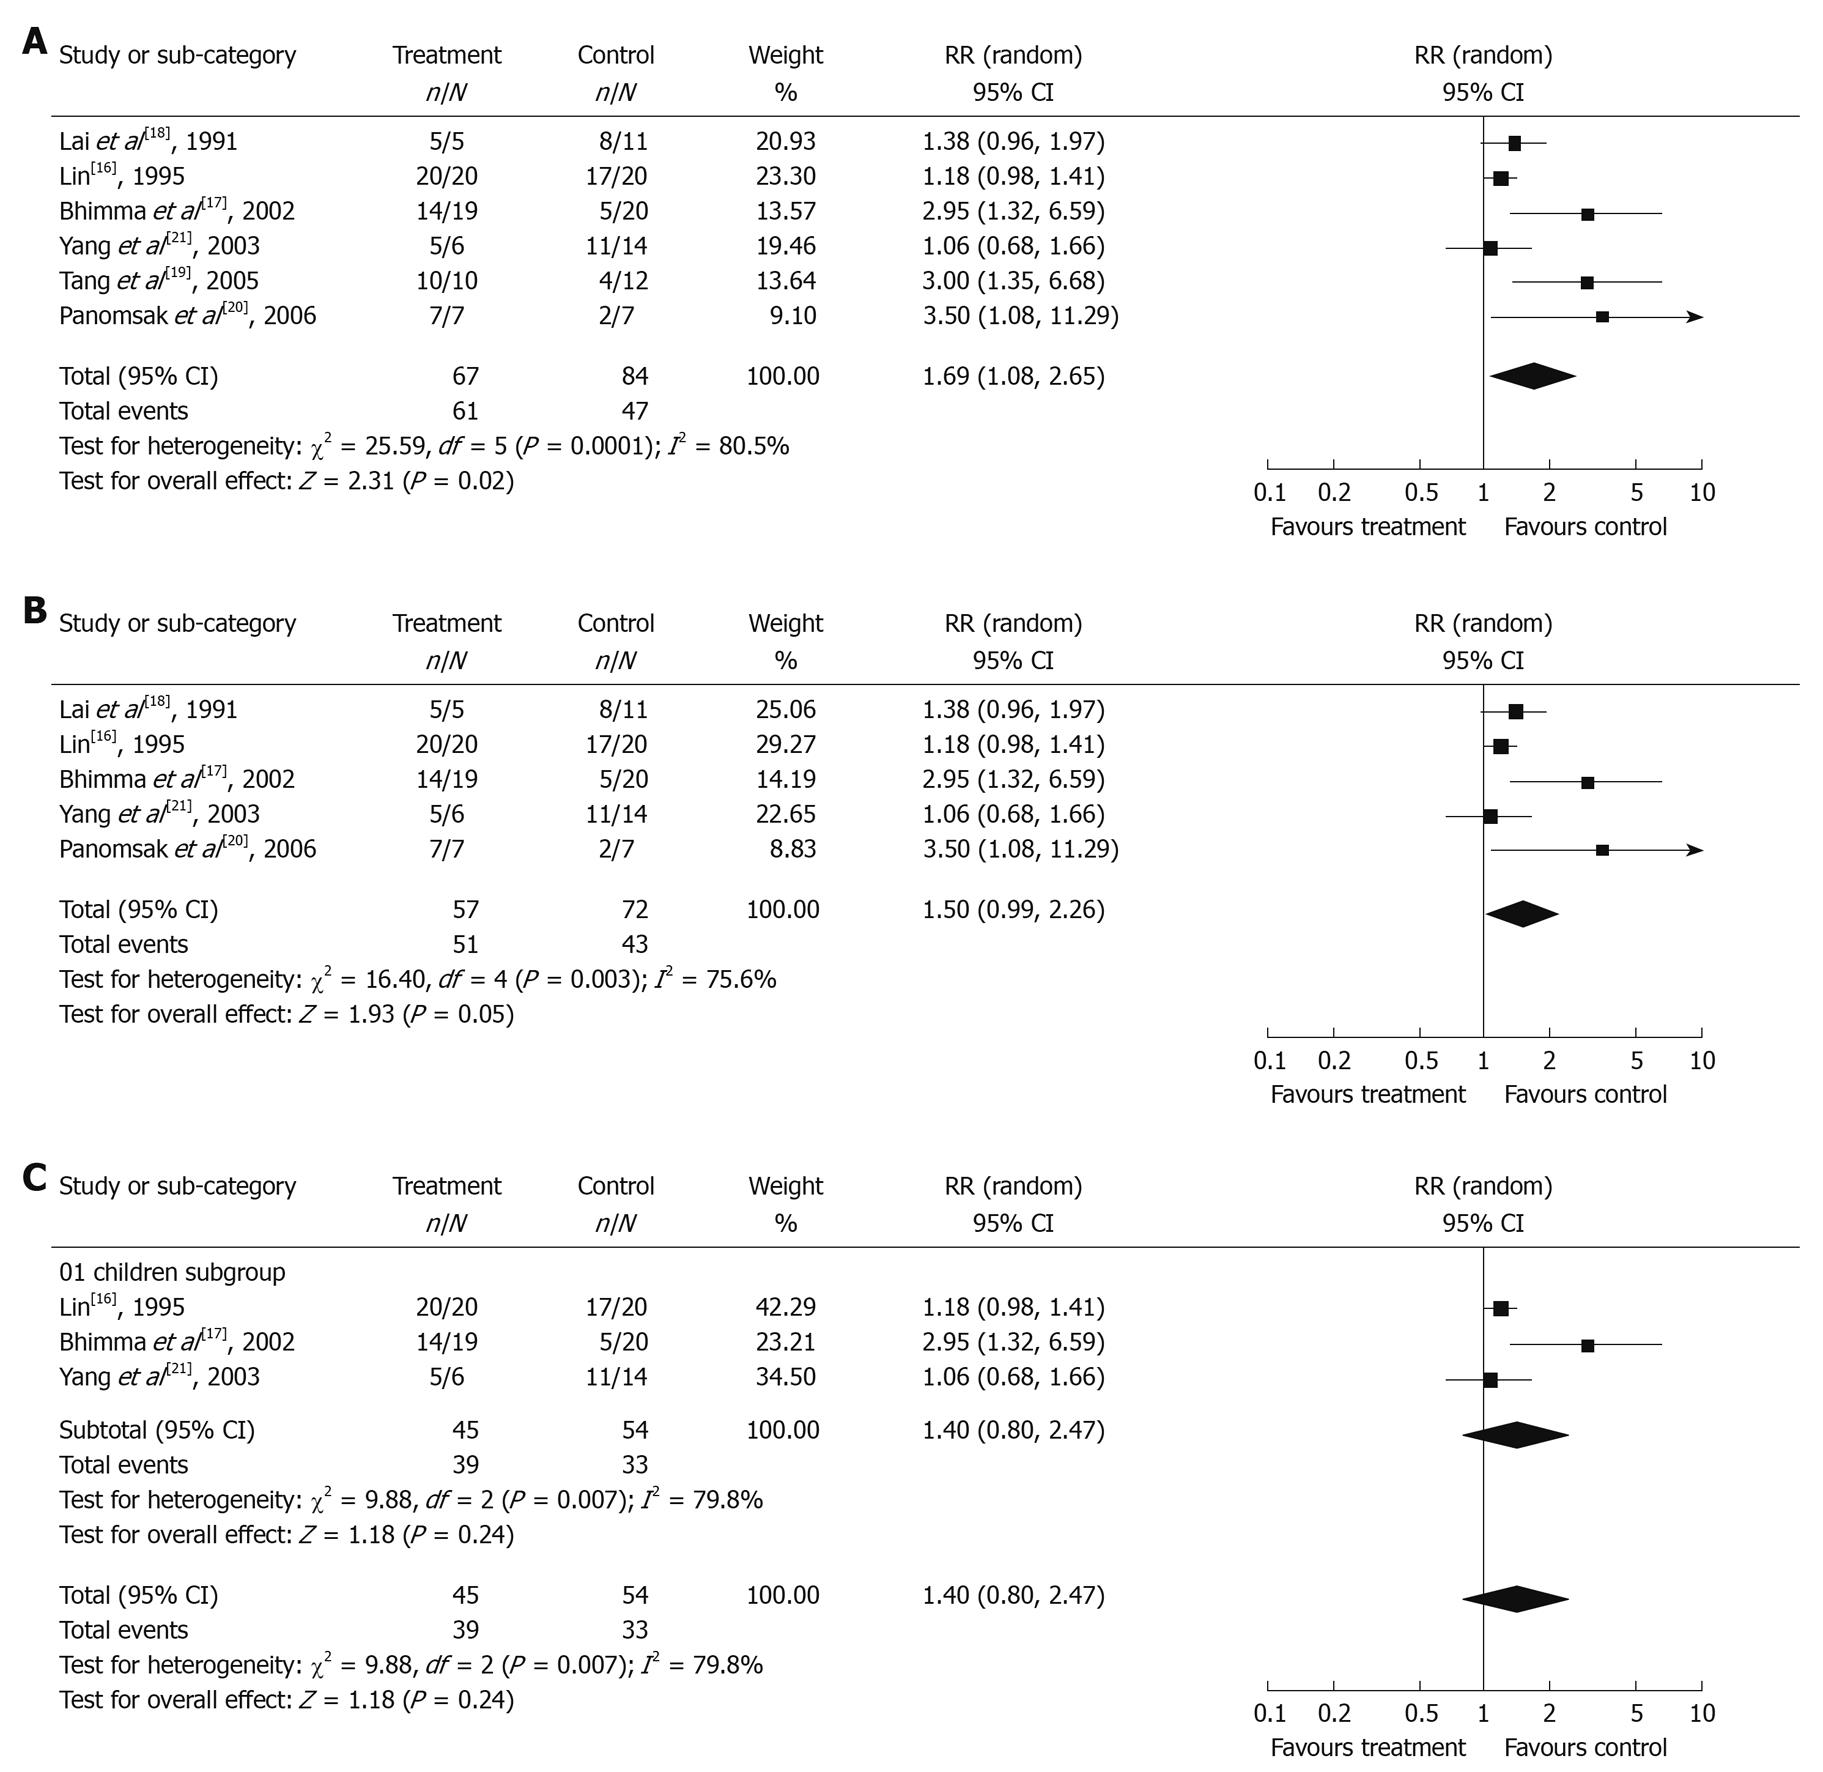
Figure 1 Proteinuria remission rate in antiviral treatment group and control group (A, B) and in pediatric patients (C).
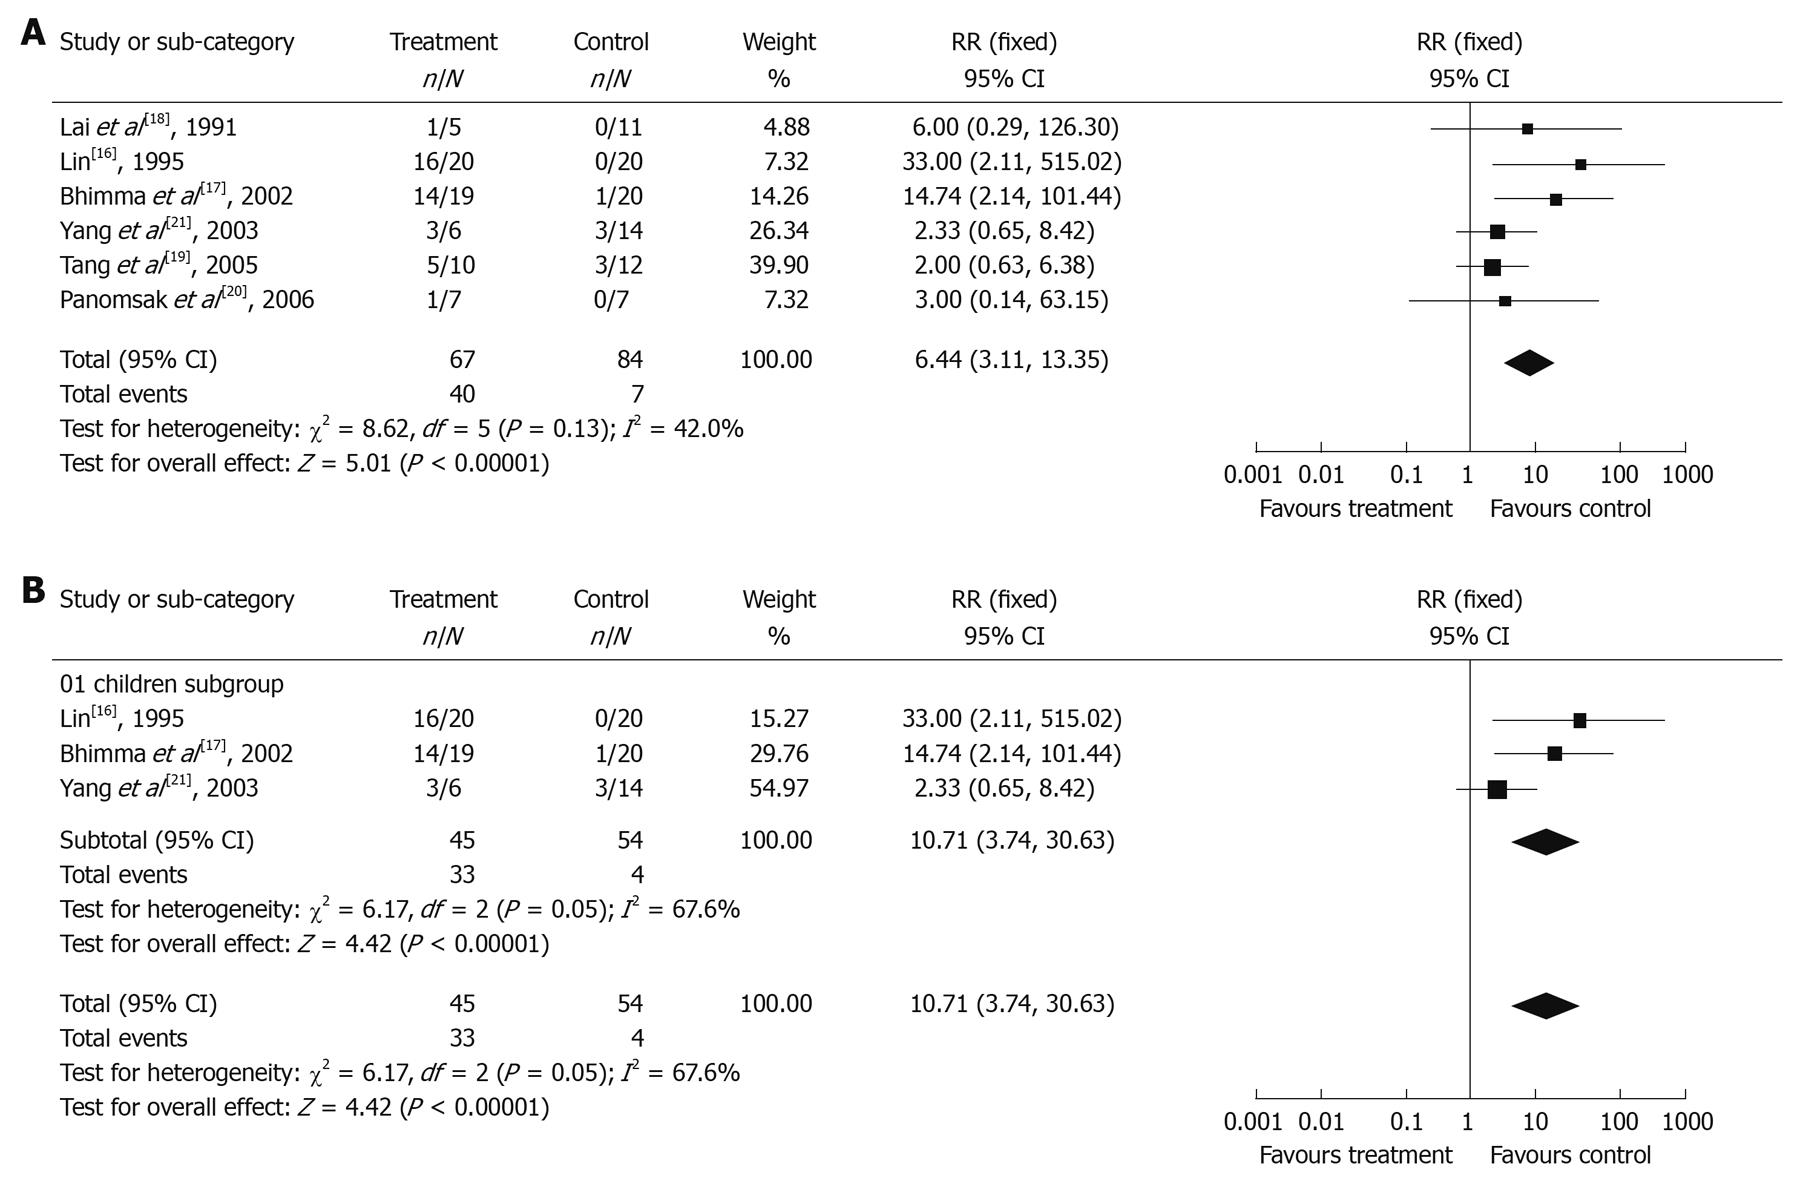
Figure 2 Clearance rate of HBeAg in antiviral treatment group and control group (A) and in pediatric patients (B).
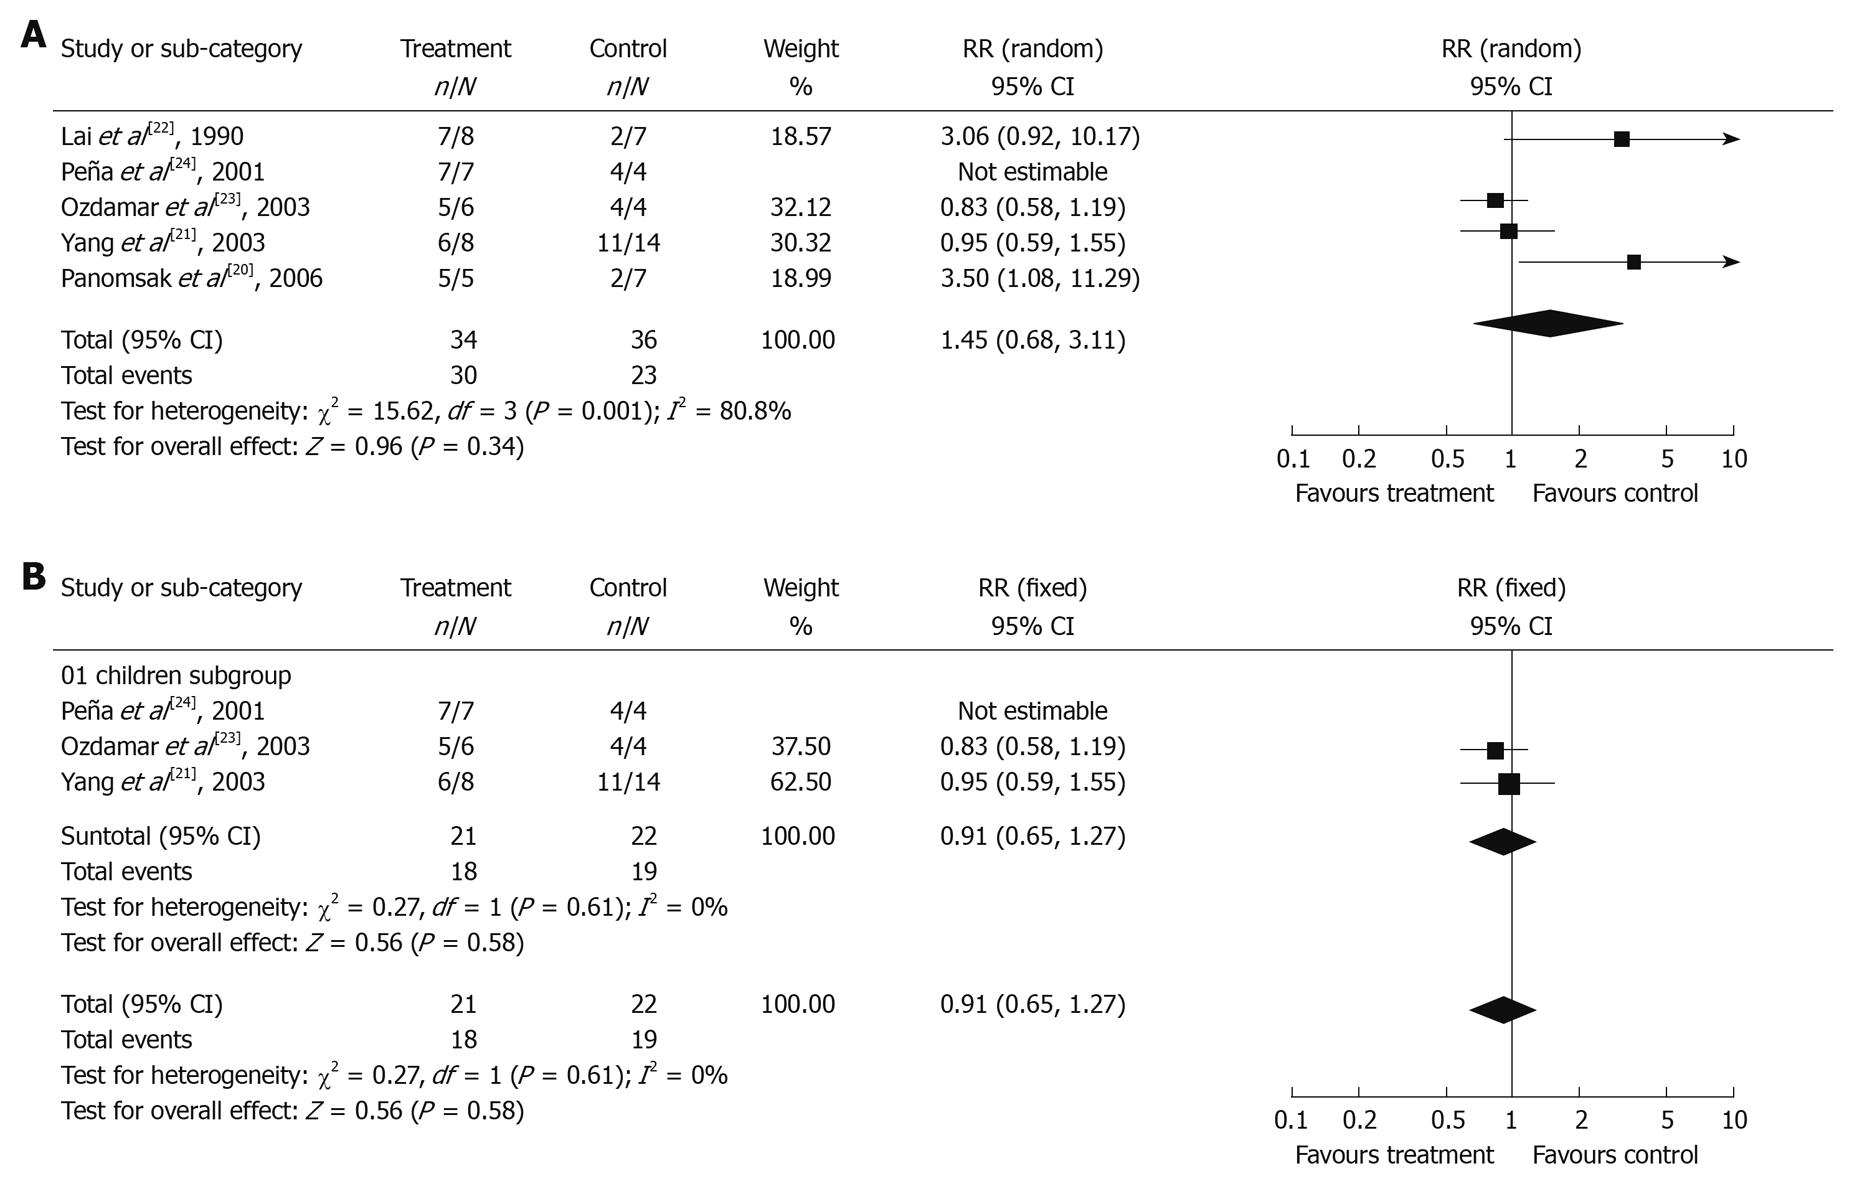
Figure 3 Proteinuria remission rate in corticosteroid treatment group and control group (A) and in pediatric patients (B).
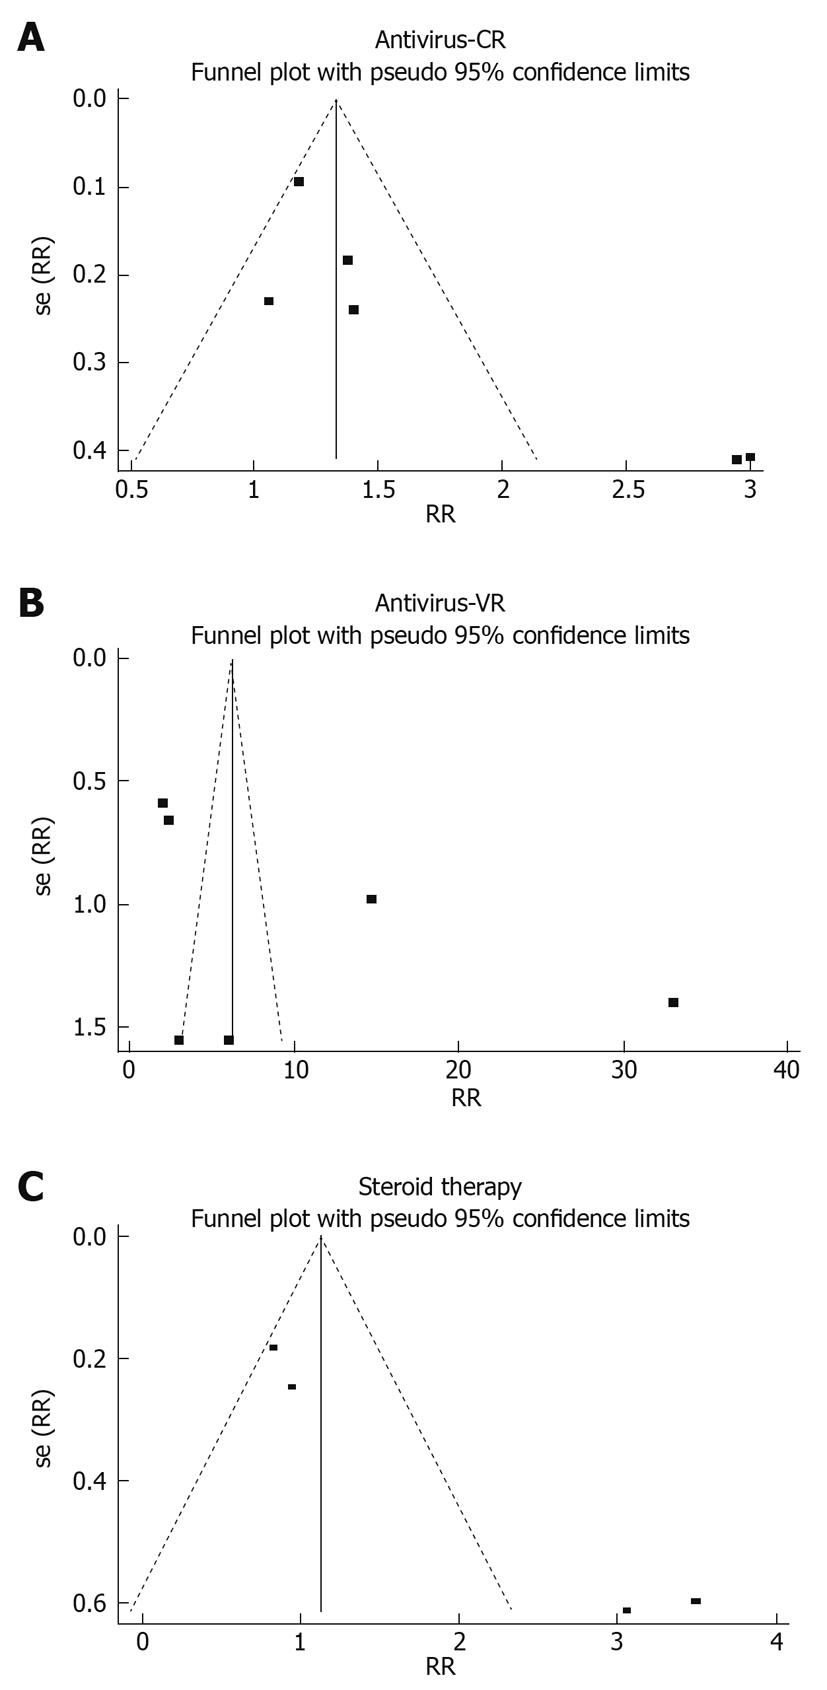
Figure 4 Funnel plots for 6 articles in meta-analysis of clinical response to antiviral therapy (A), 6 articles in meta-analysis of virologic response to antiviral therapy (B), and 5 articles in meta-analysis of clinical response to corticosteroid treatment (C).
- Citation: Zhang Y, Zhou JH, Yin XL, Wang FY. Treatment of hepatitis B virus-associated glomerulonephritis: A meta-analysis. World J Gastroenterol 2010; 16(6): 770-777
- URL: https://www.wjgnet.com/1007-9327/full/v16/i6/770.htm
- DOI: https://dx.doi.org/10.3748/wjg.v16.i6.770


