Copyright
©2010 Baishideng Publishing Group Co.
World J Gastroenterol. Nov 7, 2010; 16(41): 5211-5224
Published online Nov 7, 2010. doi: 10.3748/wjg.v16.i41.5211
Published online Nov 7, 2010. doi: 10.3748/wjg.v16.i41.5211
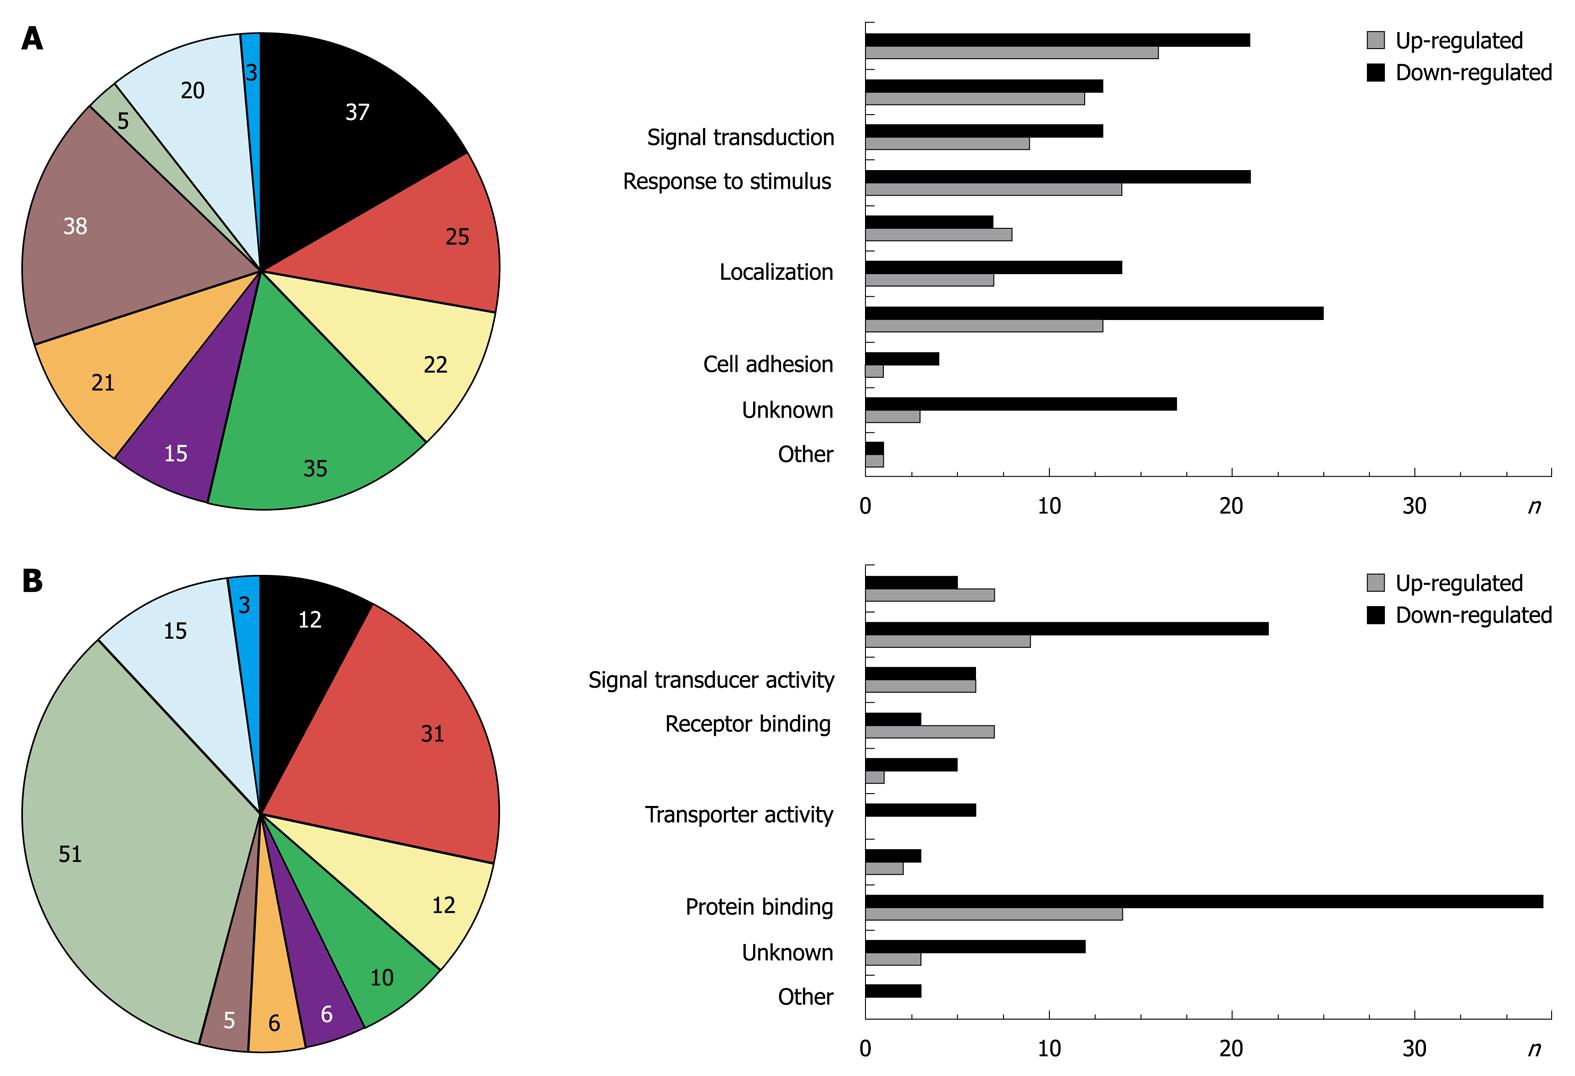
Figure 1 Genes whose expression levels were changed (n = 100) after overexpression of Smad7 in hepatic stellate cells are matched to 8 gene ontology annotations using GoMiner[13].
Left part: Percentage of genes matching to the given gene ontology. Note the total percentage is greater than 100% as the same regulated genes can be assigned to different annotations; Right part: Bar diagram shows number of upregulated (grey bars) and downregulated (black bars) genes matching to the given gene ontology (unknown = percentage/number of genes without annotation, other = percentage/number of genes which are not assignable to the given annotations). A: GO group: biological process; B: GO group: molecular function.
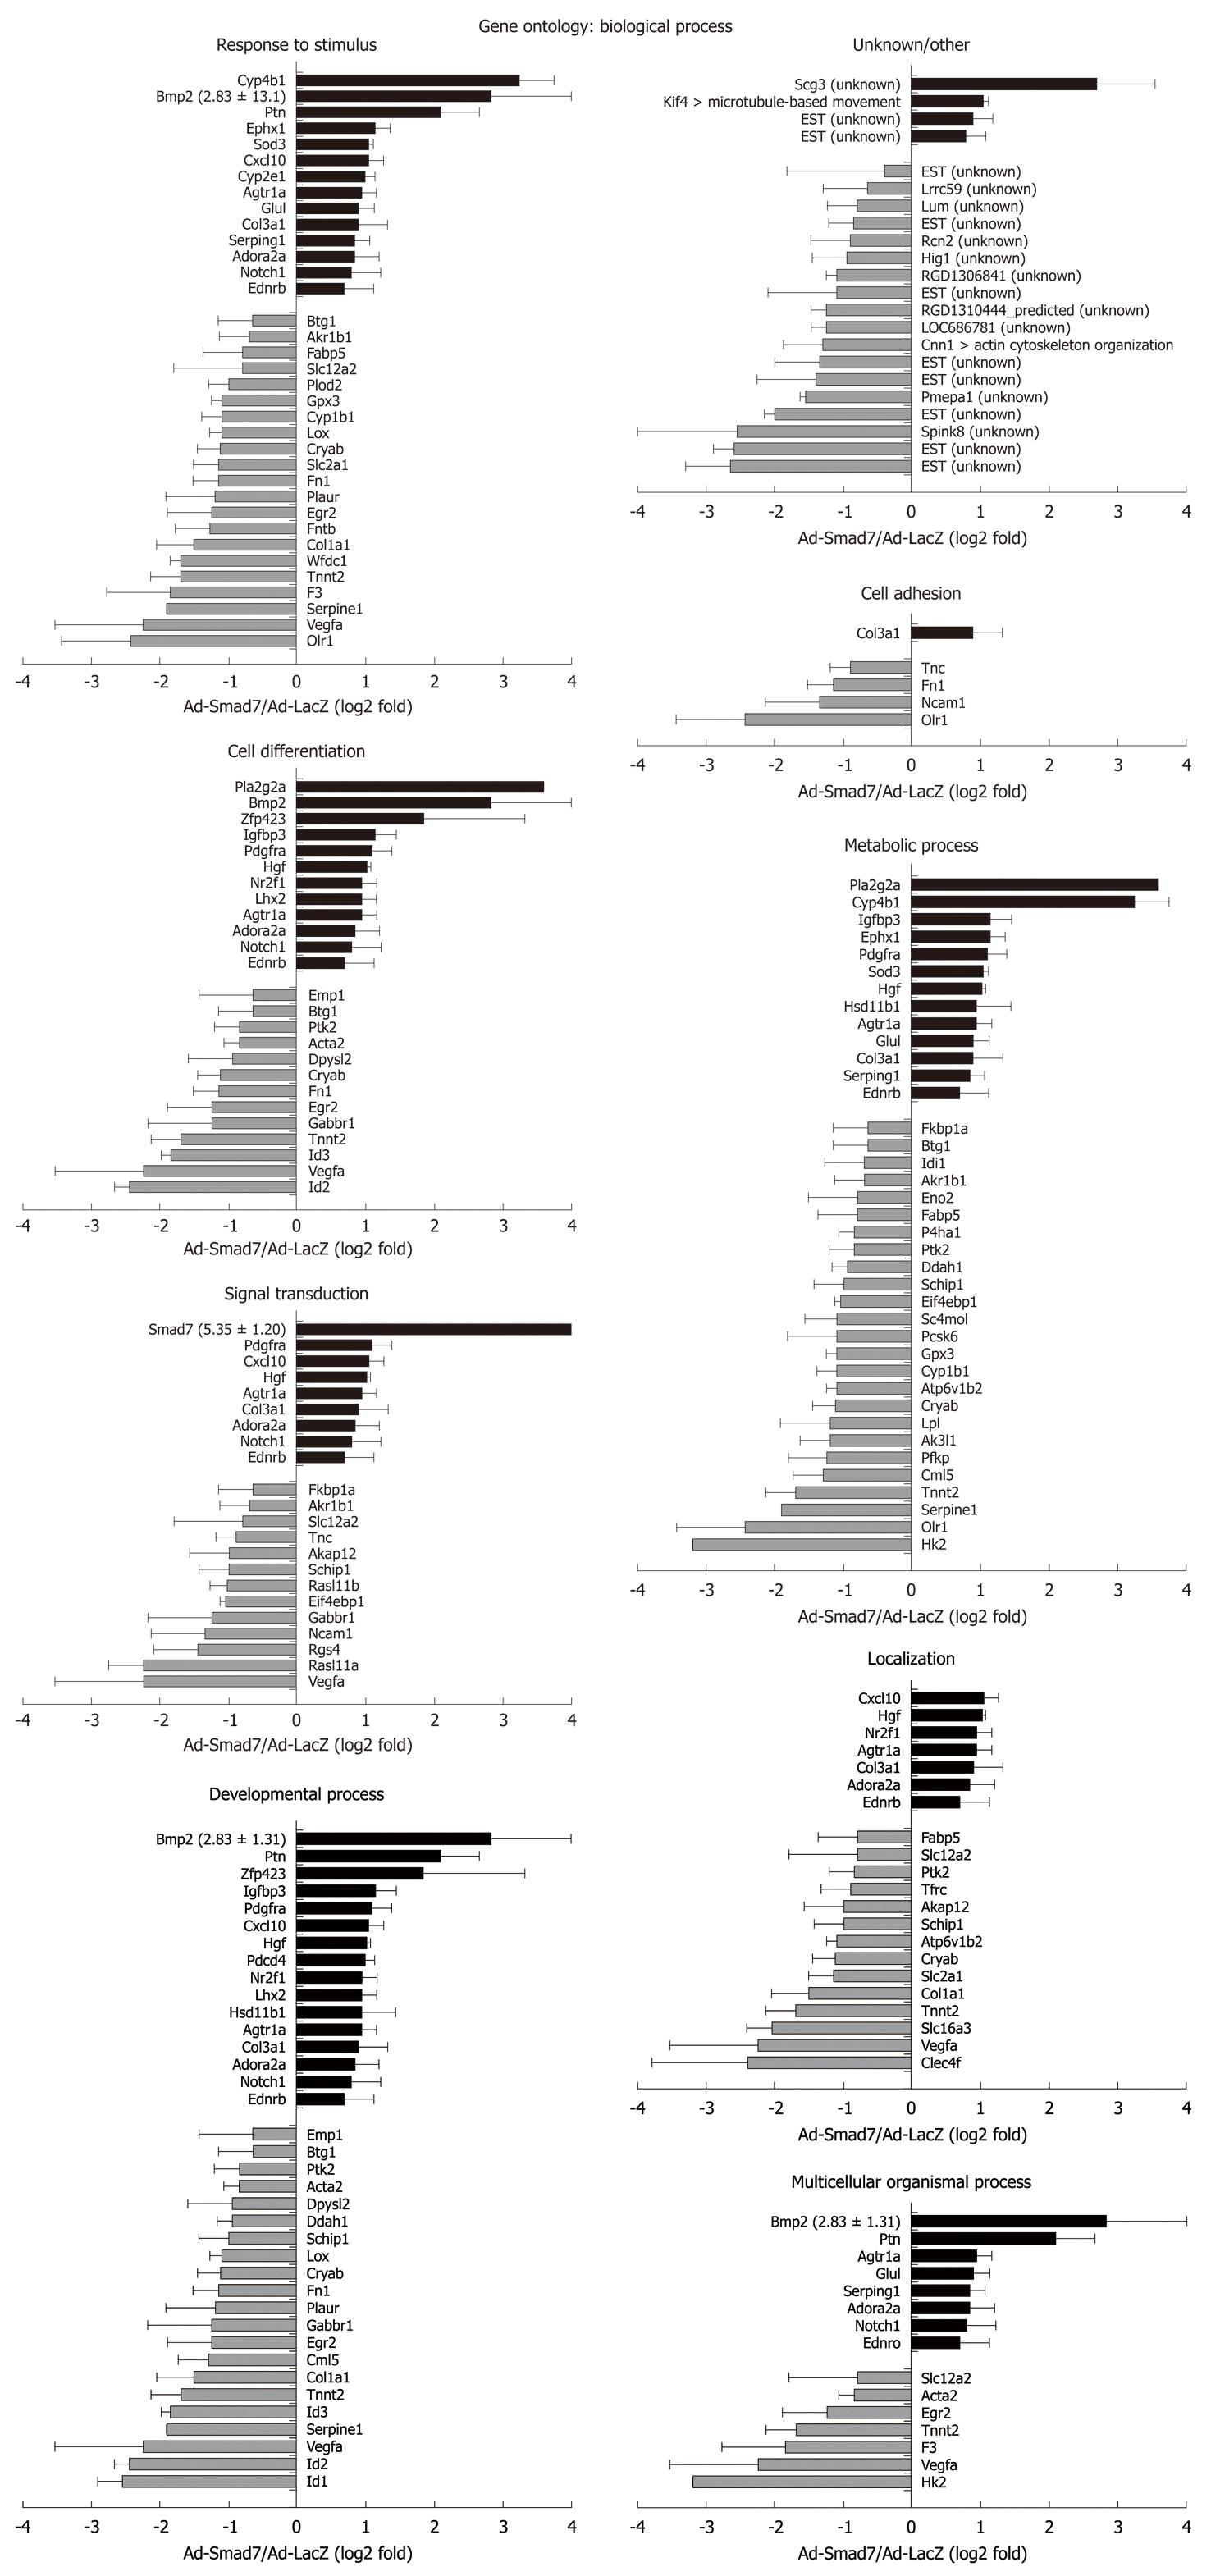
Figure 2 Genes with changed expression levels after overexpression of Smad7 are matched to 8 gene ontology terms of the biological process and to unknown/other.
Unknown: Genes without annotation; Other: Genes with another annotation not assignable to the given annotations, details in brackets. Change of expression is given as log2 value of the fold factor with the SD. Black bars: Upregulated; Gray bars: Downregulated.
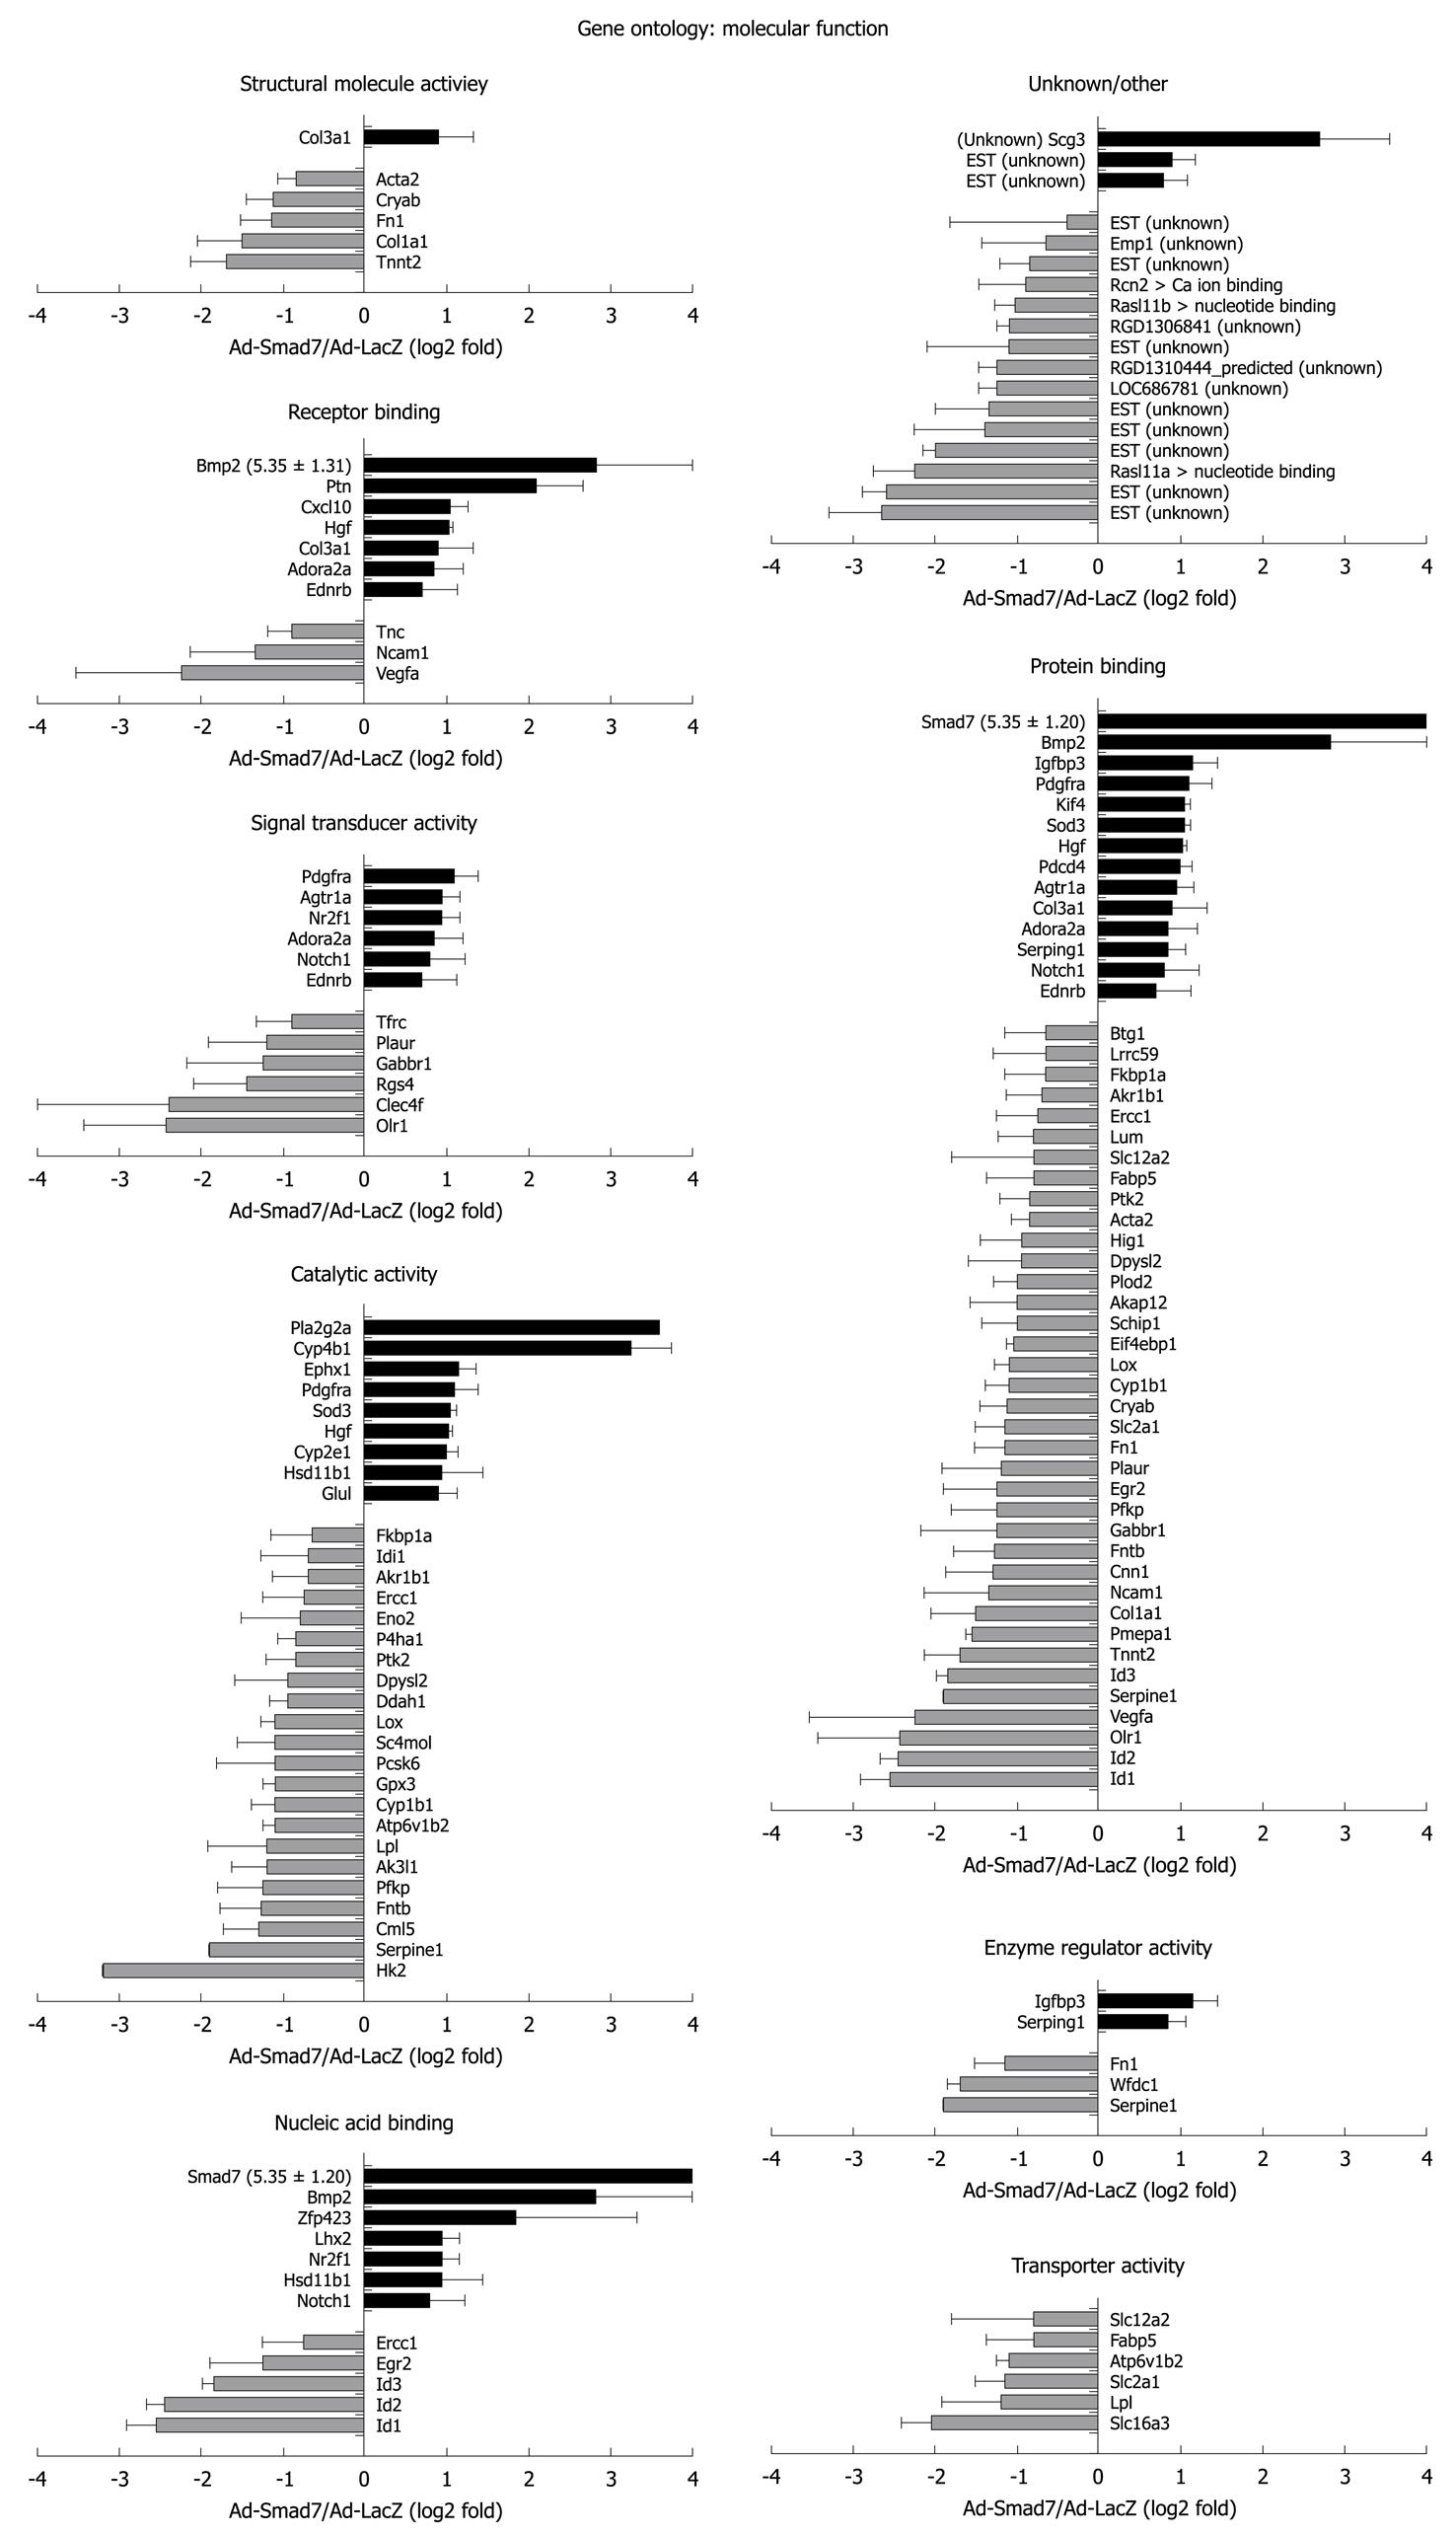
Figure 3 Genes whose expression levels were changed after overexpression of Smad7 are matched to 8 gene ontology terms of the molecular function and to unknown/other.
Unknown: Genes without annotation; Other: Genes with another annotation not assignable to the given annotations, details in brackets. Change of expression is given as log2 value of the fold factor with the SD. The term nucleic acid binding includes the annotations nucleic acid binding, transcription factor activity, RNA binding, and transcription regulator activity. Black bars: Upregulated; Gray bars: Downregulated.
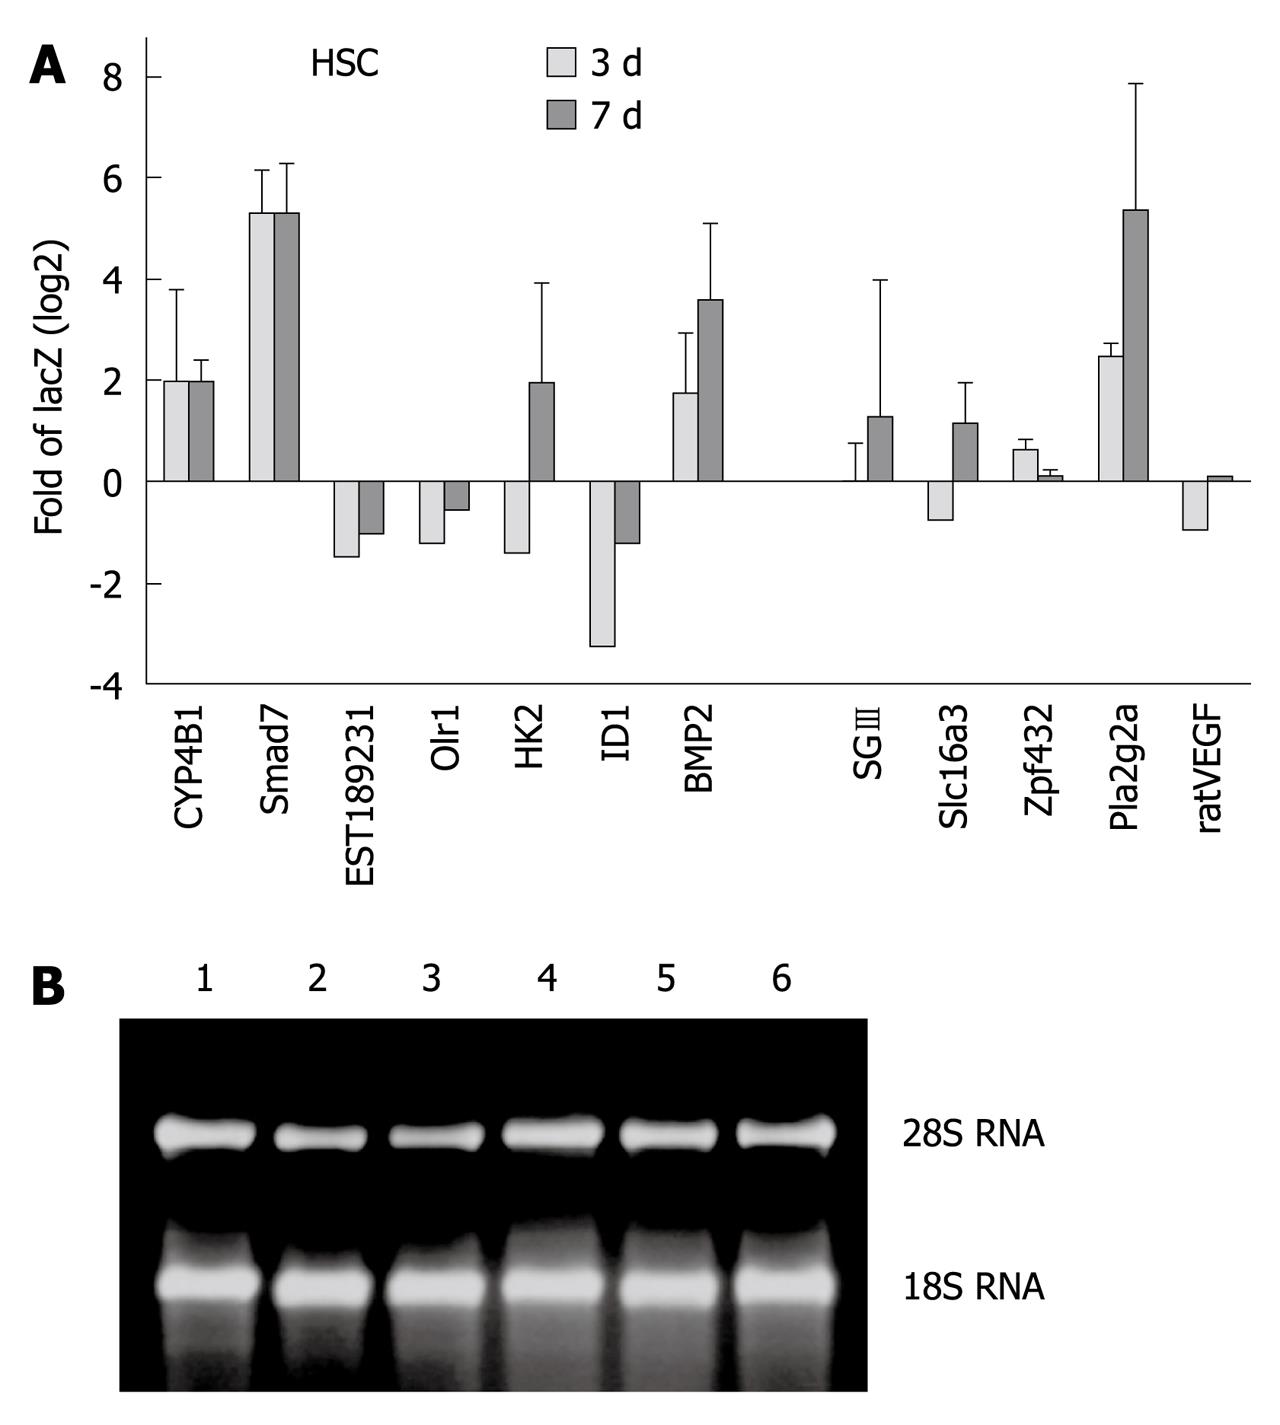
Figure 4 Validation of microarray results using quantitative real-time polymerase chain reaction.
A: SYBR Green I-based real-time quantification to compare the mRNA expression patterns of 12 selected genes in hepatic stellate cell which were infected either with AdLacZ or AdSmad7. Transforming growth factor-β RI, not affected by Smad7 overexpression, served as a house-keeping gene. Results are given as relative expression of log2 fold of LacZ. 3 d (light grey column) and 7 d (dark grey column): 3 d and 7 d after adenoviral infection. Values are the mean of three measurements each performed in duplicates ± SD from independent experiments; B: Total RNA purity and integrity was verified by formaldehyde agarose gel electrophoresis. Lane 1: LacZ, 7 d; Lane 2: LacZ, 3 d; Lane 3: Smad7, 7 d; Lane 4: Smad 7, 3 d; Lane 5: Untreated control, 7 d; Lane 6: Untreated control, 3 d.
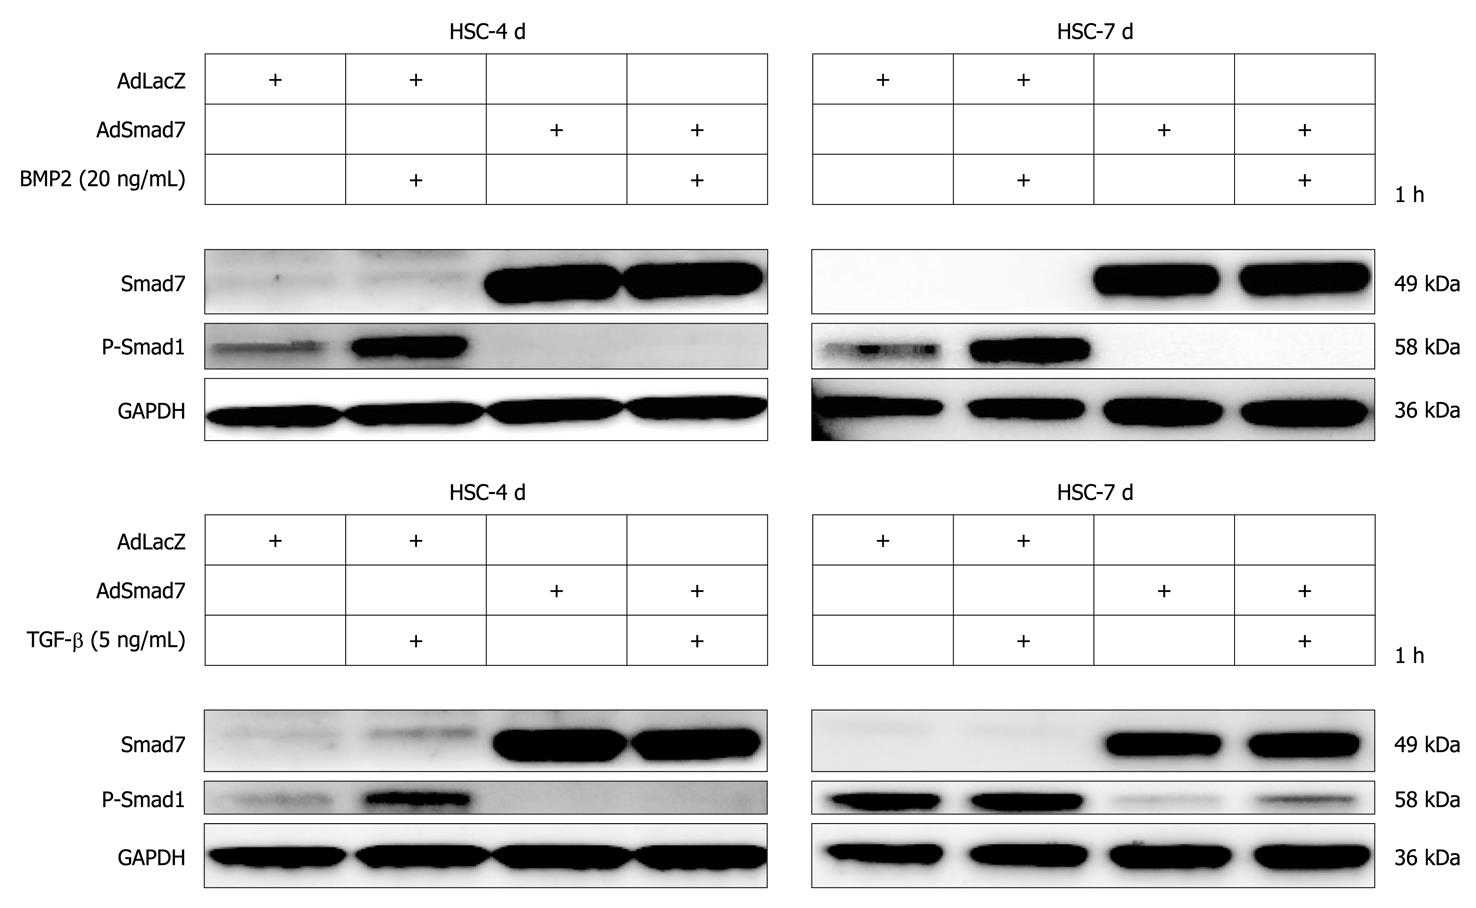
Figure 5 Smad7 overexpression inhibits BMP2 and transforming growth factor-β dependent Smad1 phosphorylation.
Transdifferentiating (4 d old) and fully activated (7 d old) hepatic stellate cells (HSCs) infected or non-infected with either AdLacZ (control) or AdSmad7 were stimulated for 1 h with 20 ng/mL BMP2 or 5 ng/mL transforming growth factor (TGF)-β as indicated. Smad7 overexpression and Smad1 phosphorylation were analysed using Western blottings. GADPH served as a reference. While transdifferentiating HSCs are sensitive to both BMP2 and TGF-β stimulation, fully activated HSCs are only responsive to BMP2.
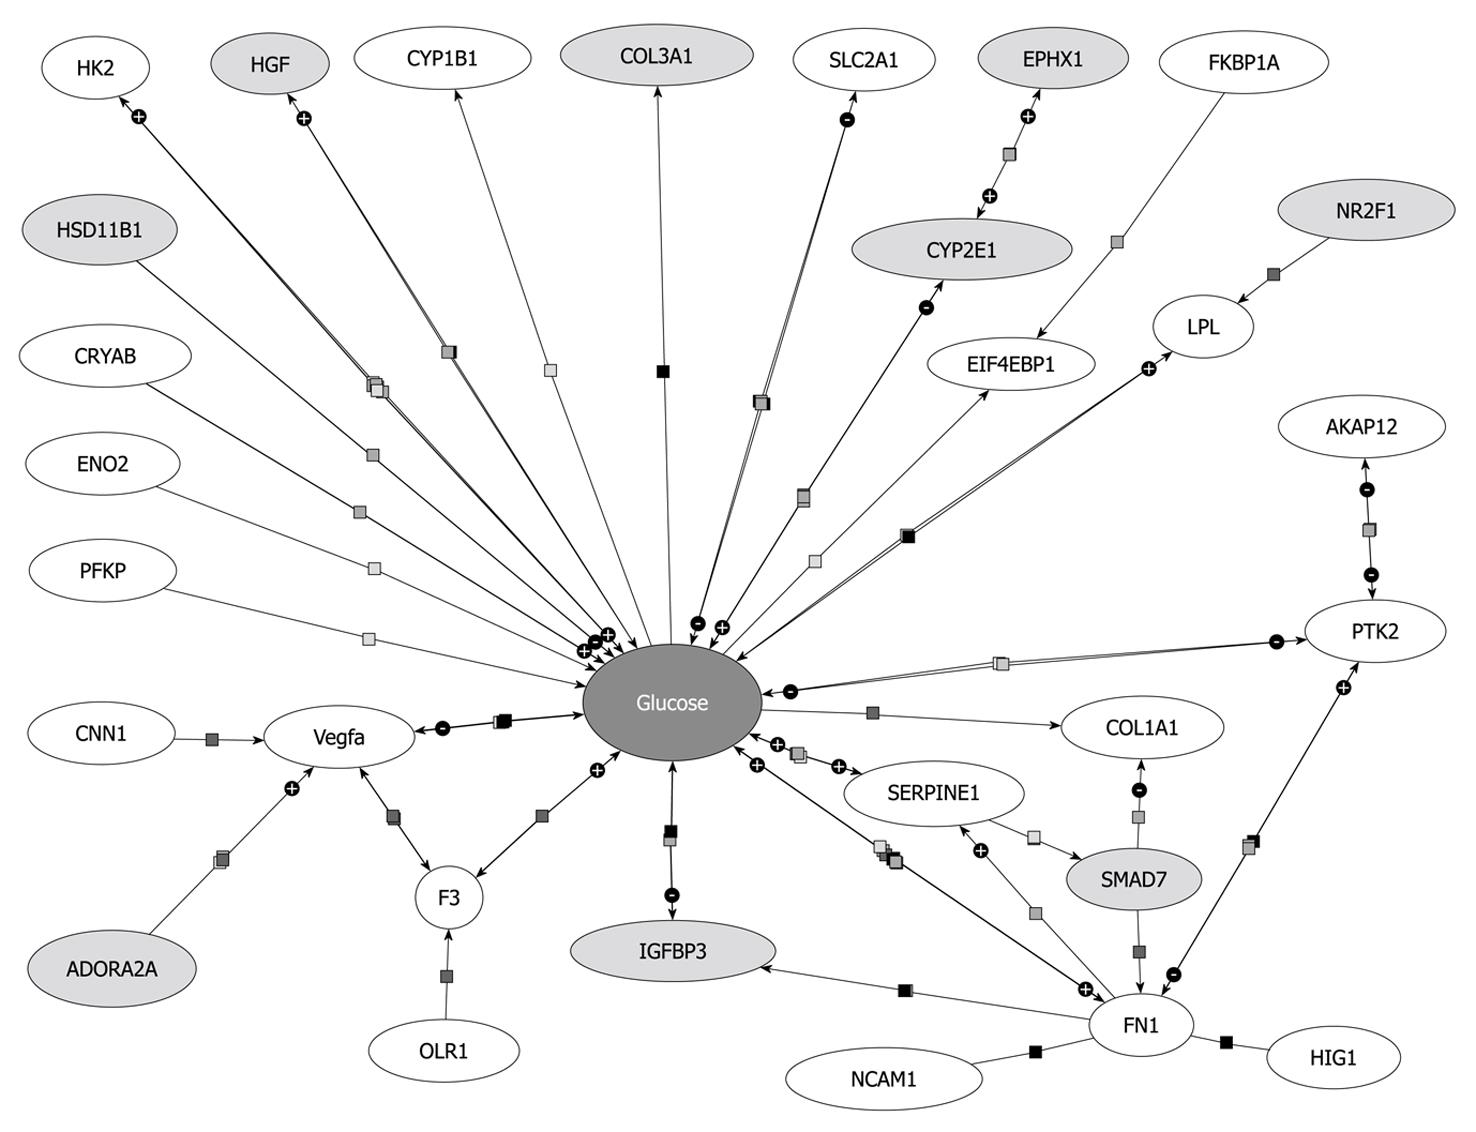
Figure 6 Biological interaction between glucose and genes up- (light grey) or down-regulated (white) in primary hepatic stellate cells after overexpression of Smad7.
Genes linked to glucose by binding or regulatory interactions are depicted as interconnecting lines between glucose and the gene symbols. Pathway analysis was done with Pathway Architect software (Stratagene).
- Citation: Denecke B, Wickert L, Liu Y, Ciuclan L, Dooley S, Meindl-Beinker NM. Smad7 dependent expression signature highlights BMP2 and HK2 signaling in HSC transdifferentiation. World J Gastroenterol 2010; 16(41): 5211-5224
- URL: https://www.wjgnet.com/1007-9327/full/v16/i41/5211.htm
- DOI: https://dx.doi.org/10.3748/wjg.v16.i41.5211


