Copyright
©2010 Baishideng Publishing Group Co.
World J Gastroenterol. Oct 28, 2010; 16(40): 5047-5056
Published online Oct 28, 2010. doi: 10.3748/wjg.v16.i40.5047
Published online Oct 28, 2010. doi: 10.3748/wjg.v16.i40.5047
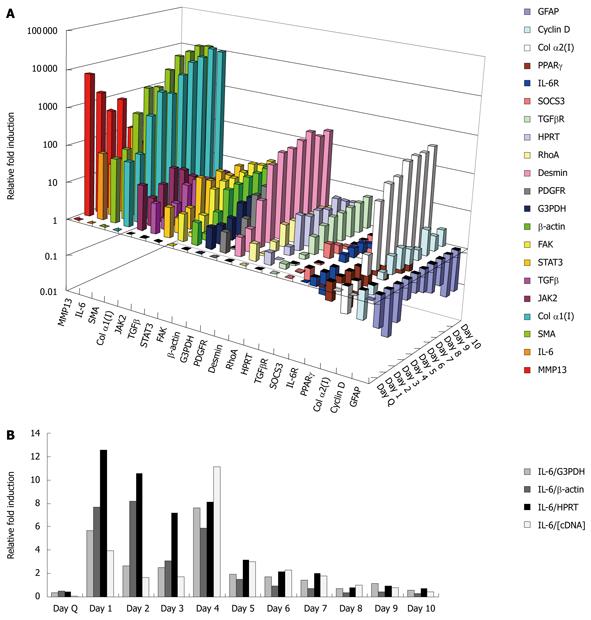
Figure 1 Gene expression profile time course.
A: Mini-array of 21 genes across 10 d in culture as analyzed by real time polymerase chain reaction. Results are averages from three separate experiments. Quiescent time point was set to 1 for all genes; B: Classic housekeeping markers (G3PDH, β-actin and HPRT) fluctuated over days in culture activation, thus they served as unreliable normalization markers. IL-6: Interleukin 6; IL-6R: Interleukin 6 receptor; SOCS: Suppressors of cytokine signaling protein; TGF: Transforming growth factor; STAT: Signal transducers and activators of transcription; PPAR: Peroxisome proliferator activated receptor; FAK: Focal adhesion kinase; JAK: Janus kinase 2; SMA: Smooth muscle α-actin; MMP: Matrix metalloproteinase.
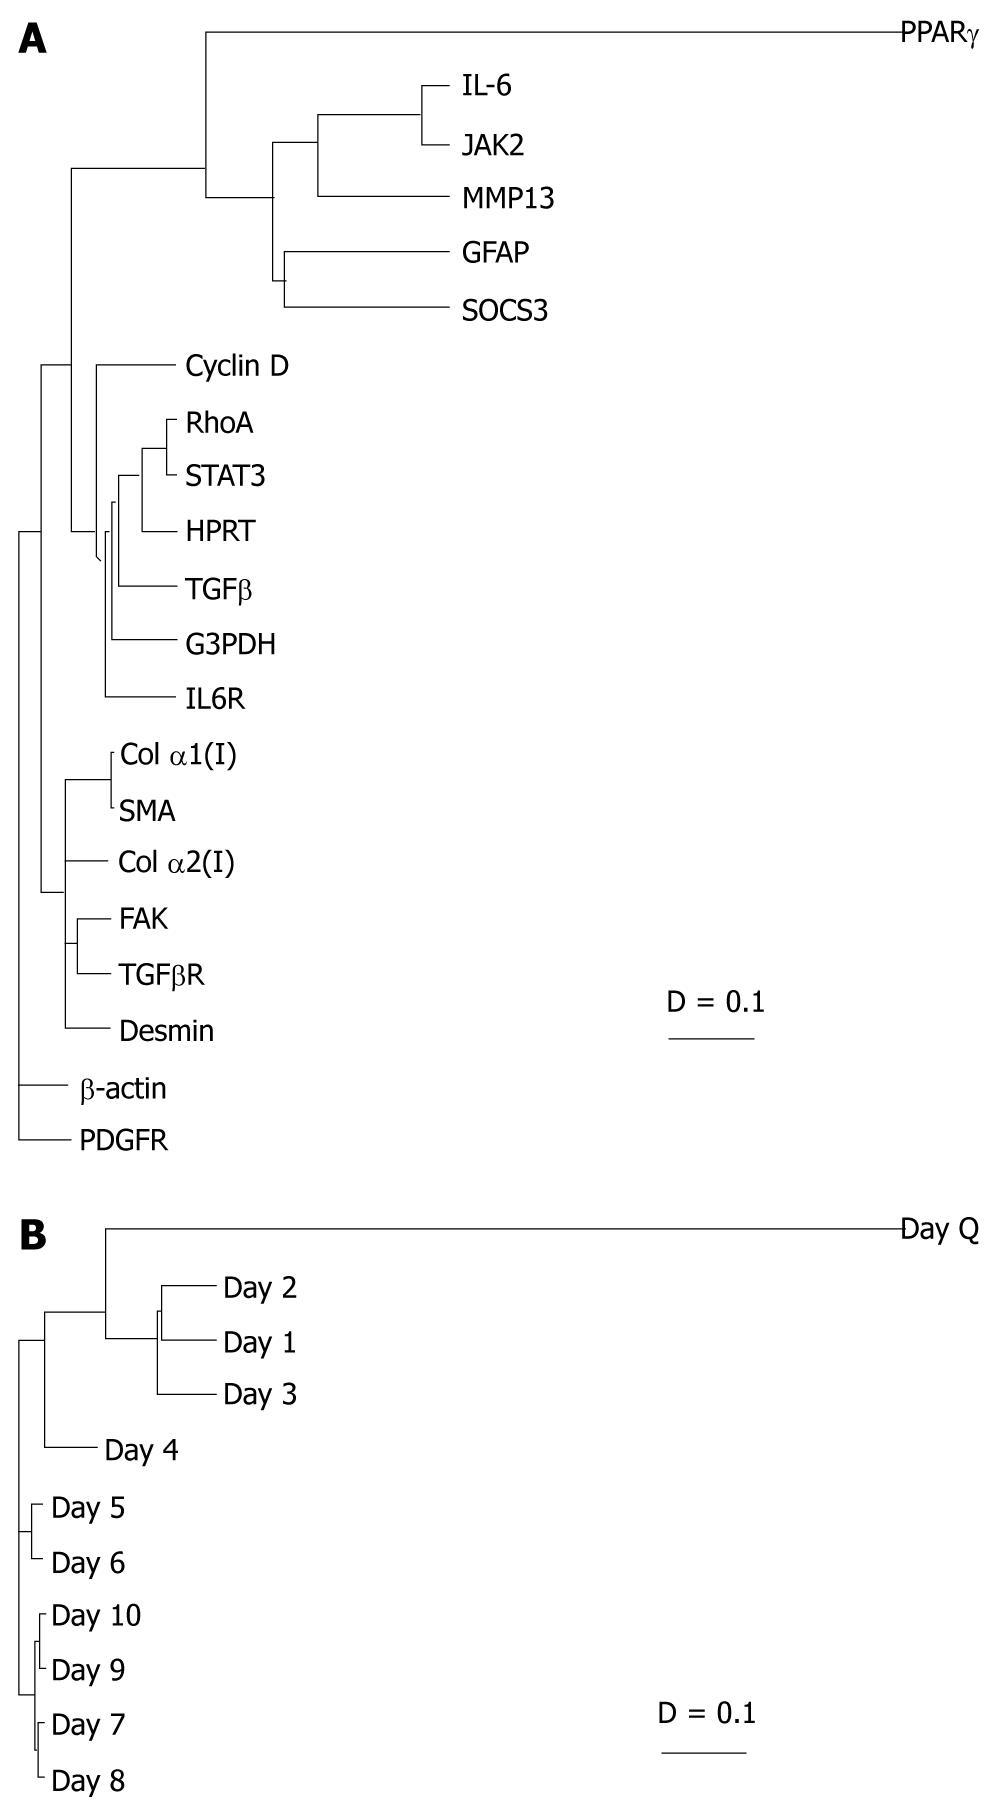
Figure 2 Clustered genetic and day analyses.
A: The genes were grouped based on the degree of relatedness in their expression patterns over time using AMADA software. Distance relationships were calculated using Spearman rank correlation (D = 0-2). The shorter the distance between two genes, the more similar the expression profile over days in culture; B: The clustering tree demonstrated which days in culture were most coordinately regulated. As expected, day Q branches alone, while culture-activated HSCs are more closely regulated. Unexpectedly, day 4 also branched alone. IL-6: Interleukin 6; SOCS: Suppressors of cytokine signaling protein; TGF: Transforming growth factor; STAT: Signal transducers and activators of transcription; PPAR: Peroxisome proliferator activated receptor; FAK: Focal adhesion kinase; JAK: Janus kinase 2; SMA: Smooth muscle α-actin; MMP: Matrix metalloproteinase.
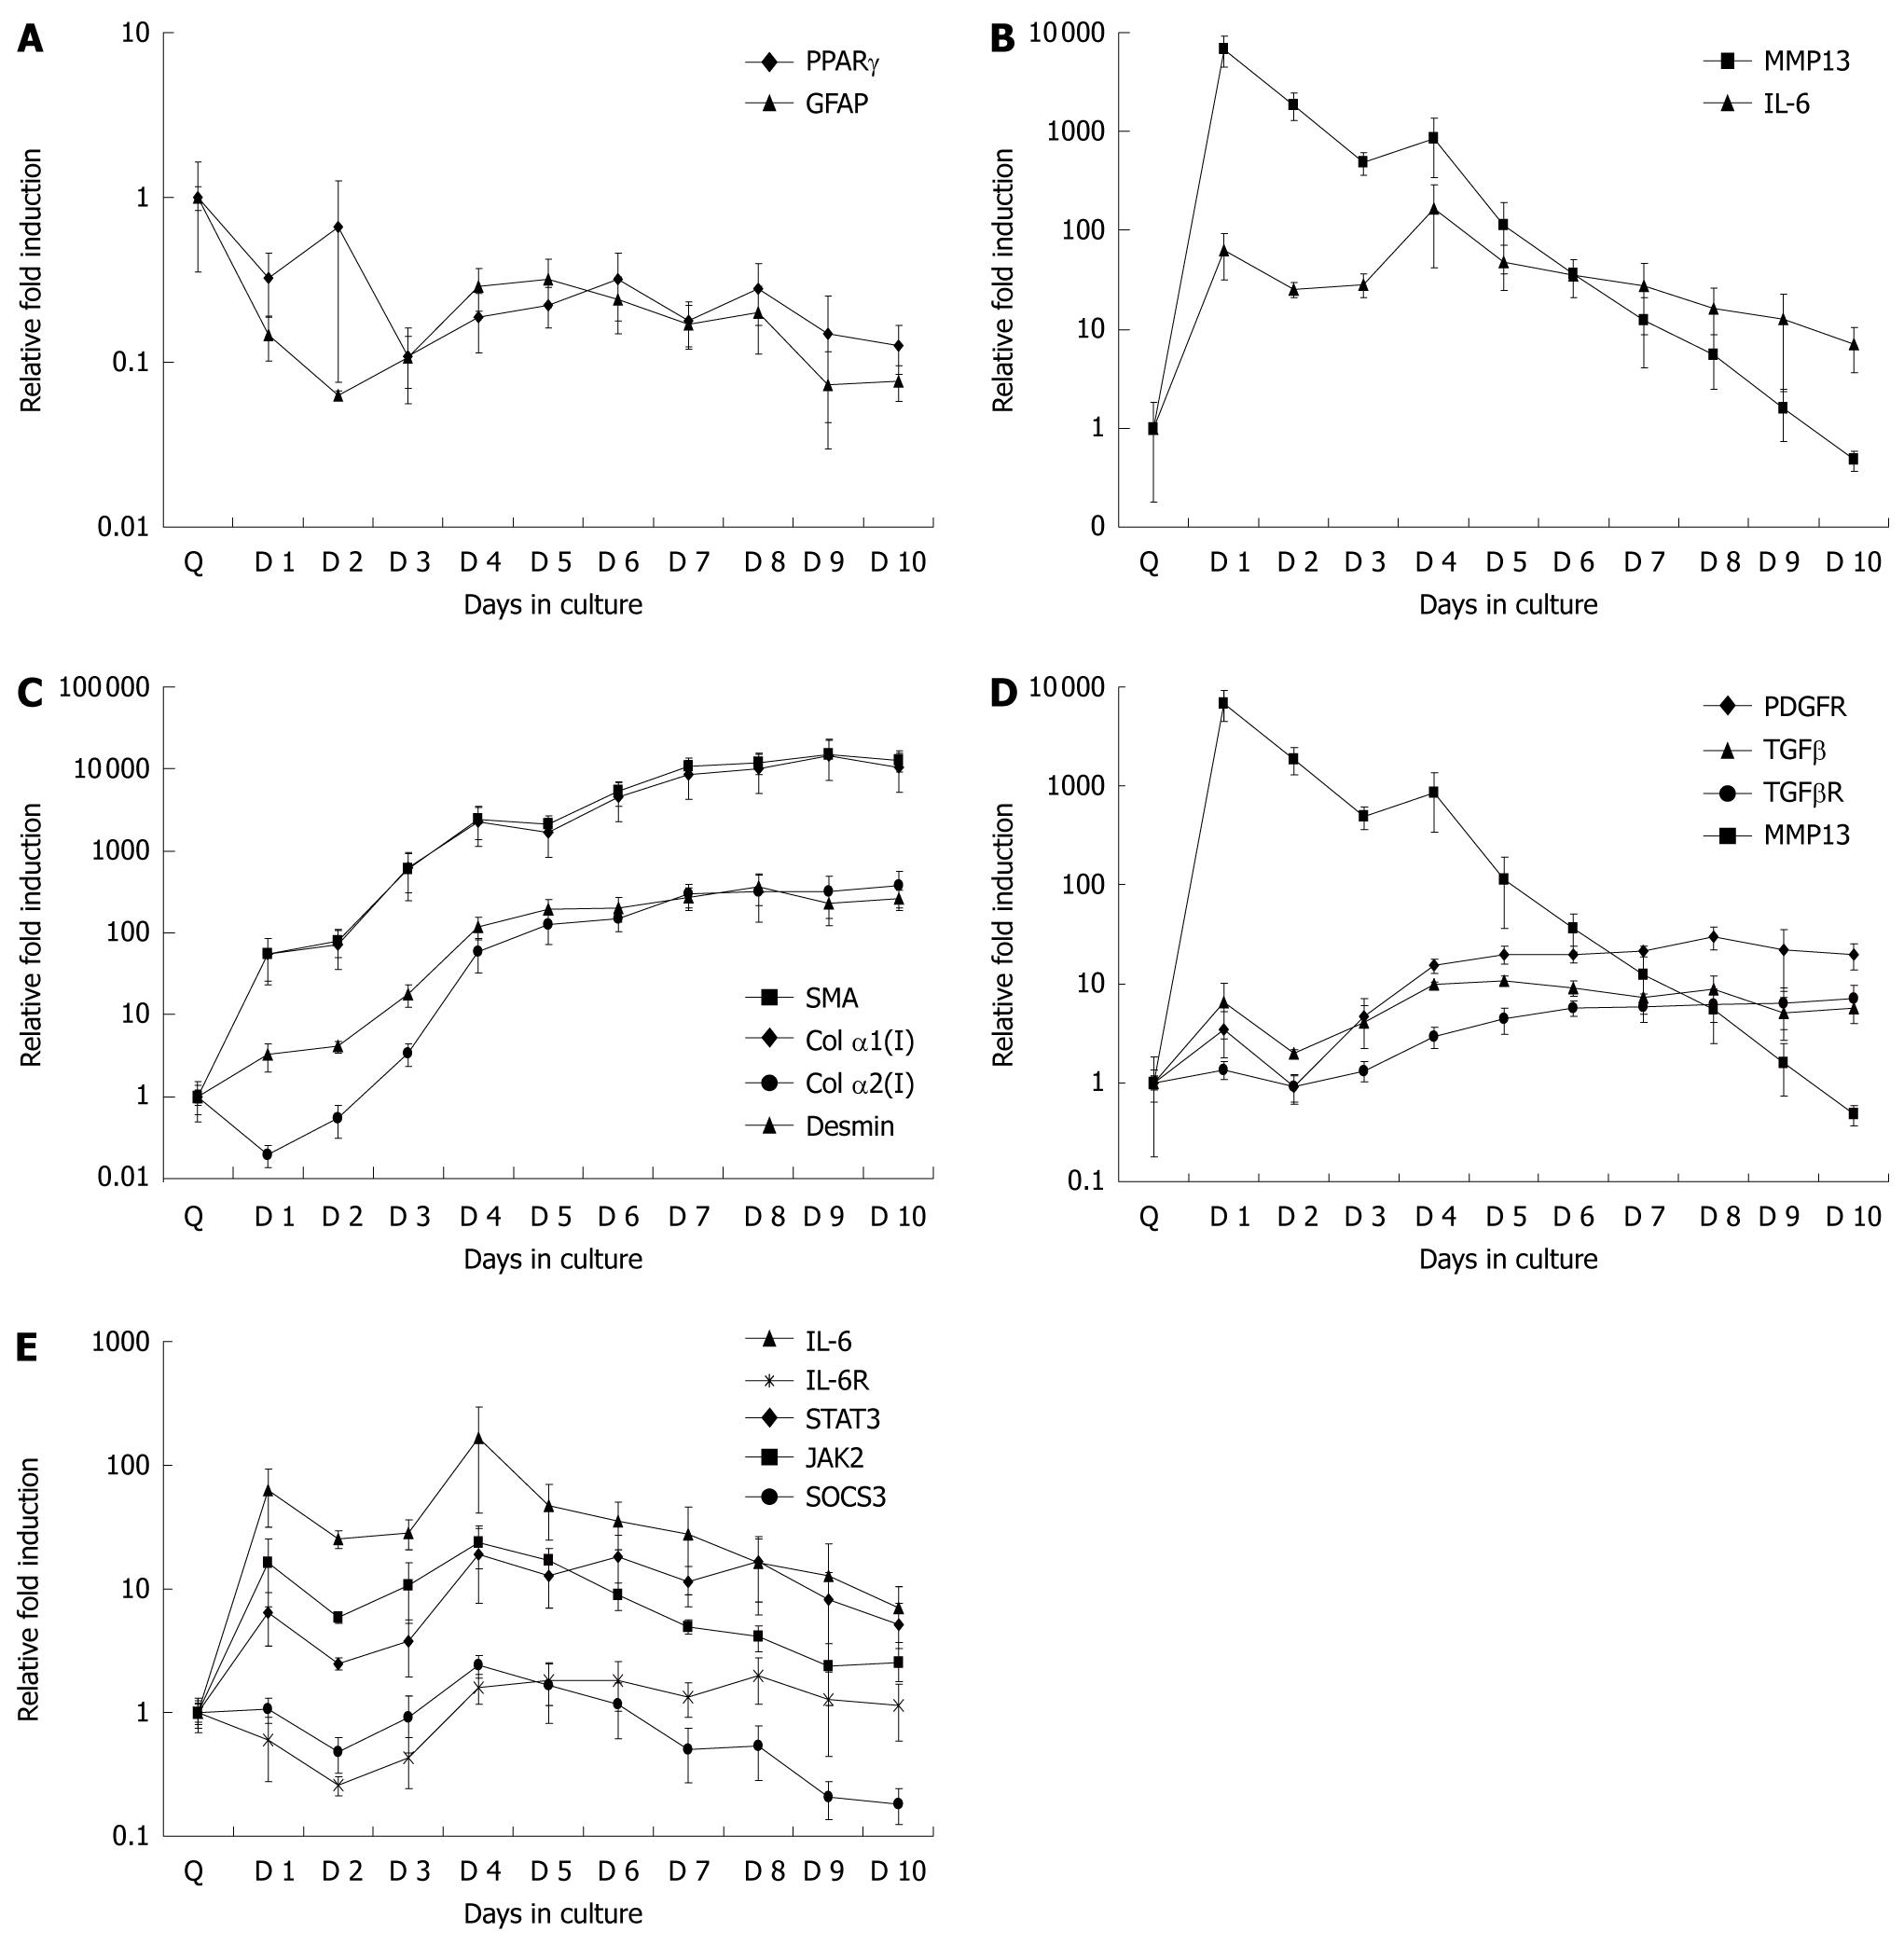
Figure 3 Gene expression markers during different stages of hepatic stellate cells activation.
A: Markers of quiescence, early and late activation, fibrosis and the IL-6 signaling pathway (A-E, respectively) were examined over 10 d in culture. Real time polymerase chain reaction was used to analyze gene expression. Fold induction was relative to day Q expression levels. Data are presented as mean ± SE. IL-6: Interleukin 6; IL-6R: Interleukin 6 receptor; SOCS: Suppressors of cytokine signaling protein; TGF: Transforming growth factor; STAT: Signal transducers and activators of transcription; PPAR: Peroxisome proliferator activated receptor; JAK: Janus kinase 2; SMA: Smooth muscle α-actin; MMP: Matrix metalloproteinase.
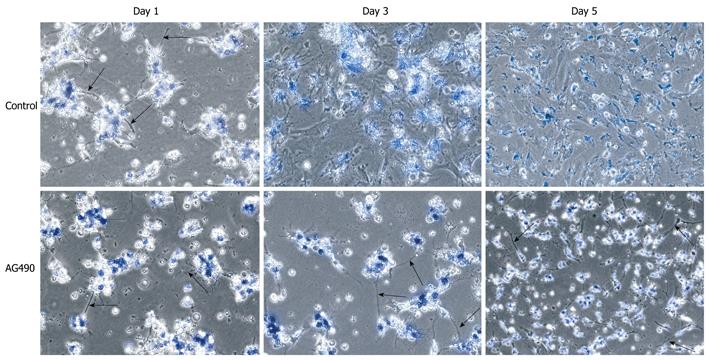
Figure 4 Inhibition of JAK/STAT signaling pathway: morphological alterations.
Culture activated hepatic stellate cells were treated continually with AG490 throughout a five-day period and subsequently analyzed morphologically at days 1, 3 and 5. Cells treated with AG490 maintained their cytoplasmic projections (black arrows) throughout the five days of culture activation, whereas the control cells lost these processes as early as day 3.
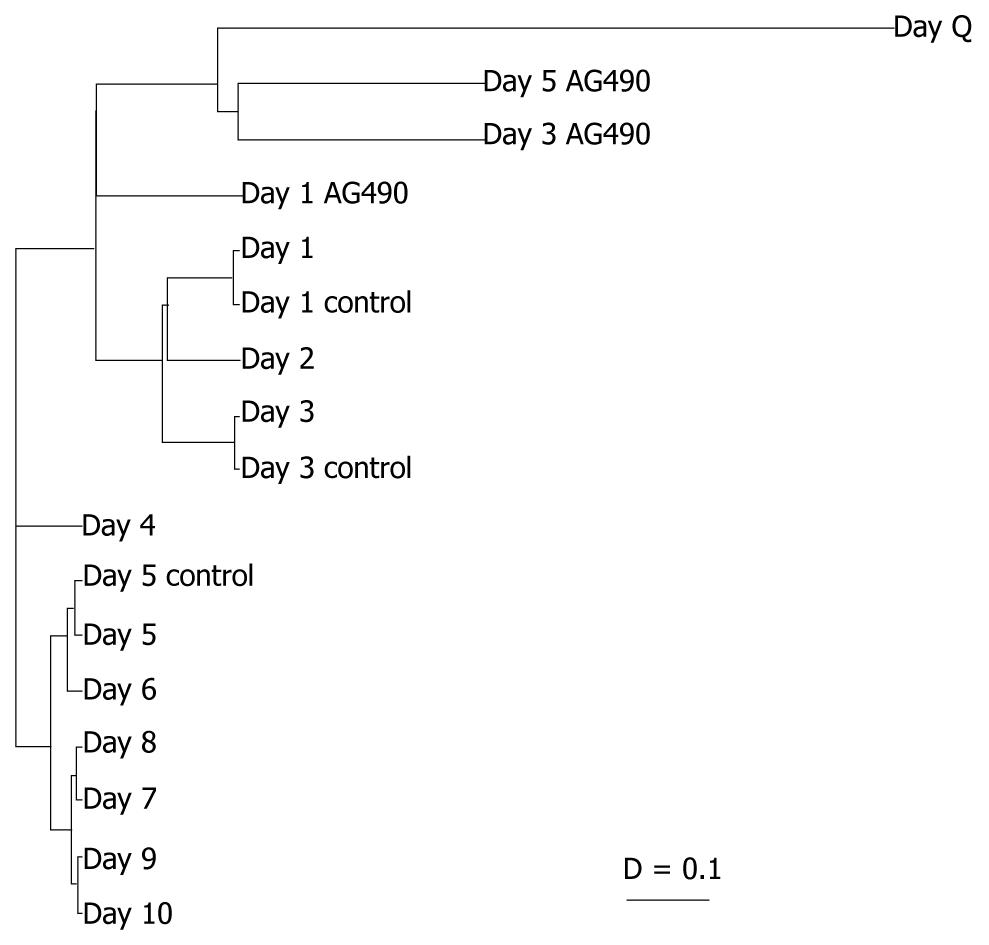
Figure 5 Inhibition of JAK/STAT signaling pathway: cluster analyses.
AMADA software was used to detect any relationships between the days in culture treated with or without AG490 over a five-day period. Distance relationships were calculated using Spearman rank correlation (D = 0-2). The shorter the distance between two genes, the more similar the expression profile over days in culture. Data from the treated cells (days 1, 3 and 5) were incorporated with the previous data for days in culture (day Q-day 10) to demonstrate days of similarity based on gene expression. The clustering showed that the gene expression profile of HSCs treated with AG490 was highly related to the expression profile of the day Q hepatic stellate cells.
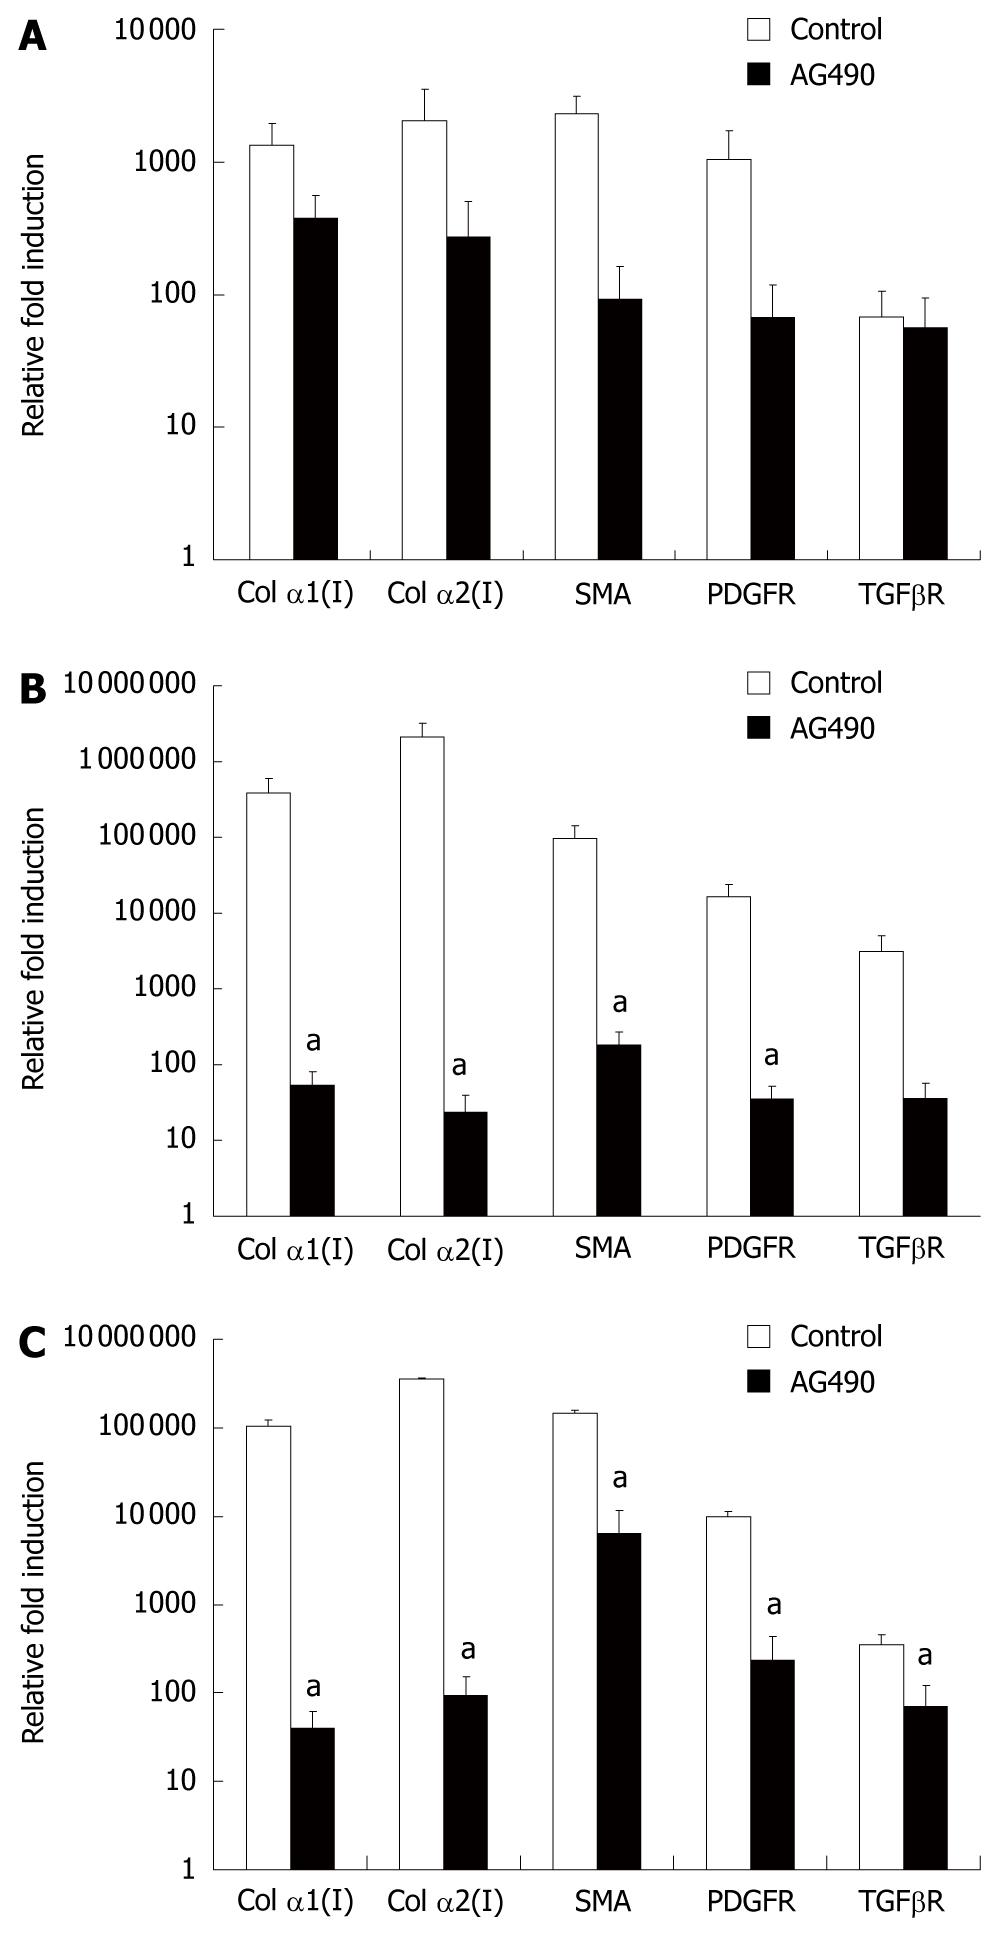
Figure 6 Inhibition of JAK/STAT signaling pathway: genetic alterations of fibrotic markers.
mRNA expression of fibrotic genes from days 1, 3 and 5 (A-C, respectively) culture-activated hepatic stellate cells treated with or without AG490 were analyzed by real time polymerase chain reaction. Data were presented as mean ± SE. aP < 0.05 compared to control.
- Citation: Lakner AM, Moore CC, Gulledge AA, Schrum LW. Daily genetic profiling indicates JAK/STAT signaling promotes early hepatic stellate cell transdifferentiation. World J Gastroenterol 2010; 16(40): 5047-5056
- URL: https://www.wjgnet.com/1007-9327/full/v16/i40/5047.htm
- DOI: https://dx.doi.org/10.3748/wjg.v16.i40.5047


