Copyright
©2010 Baishideng.
World J Gastroenterol. Jan 28, 2010; 16(4): 501-507
Published online Jan 28, 2010. doi: 10.3748/wjg.v16.i4.501
Published online Jan 28, 2010. doi: 10.3748/wjg.v16.i4.501
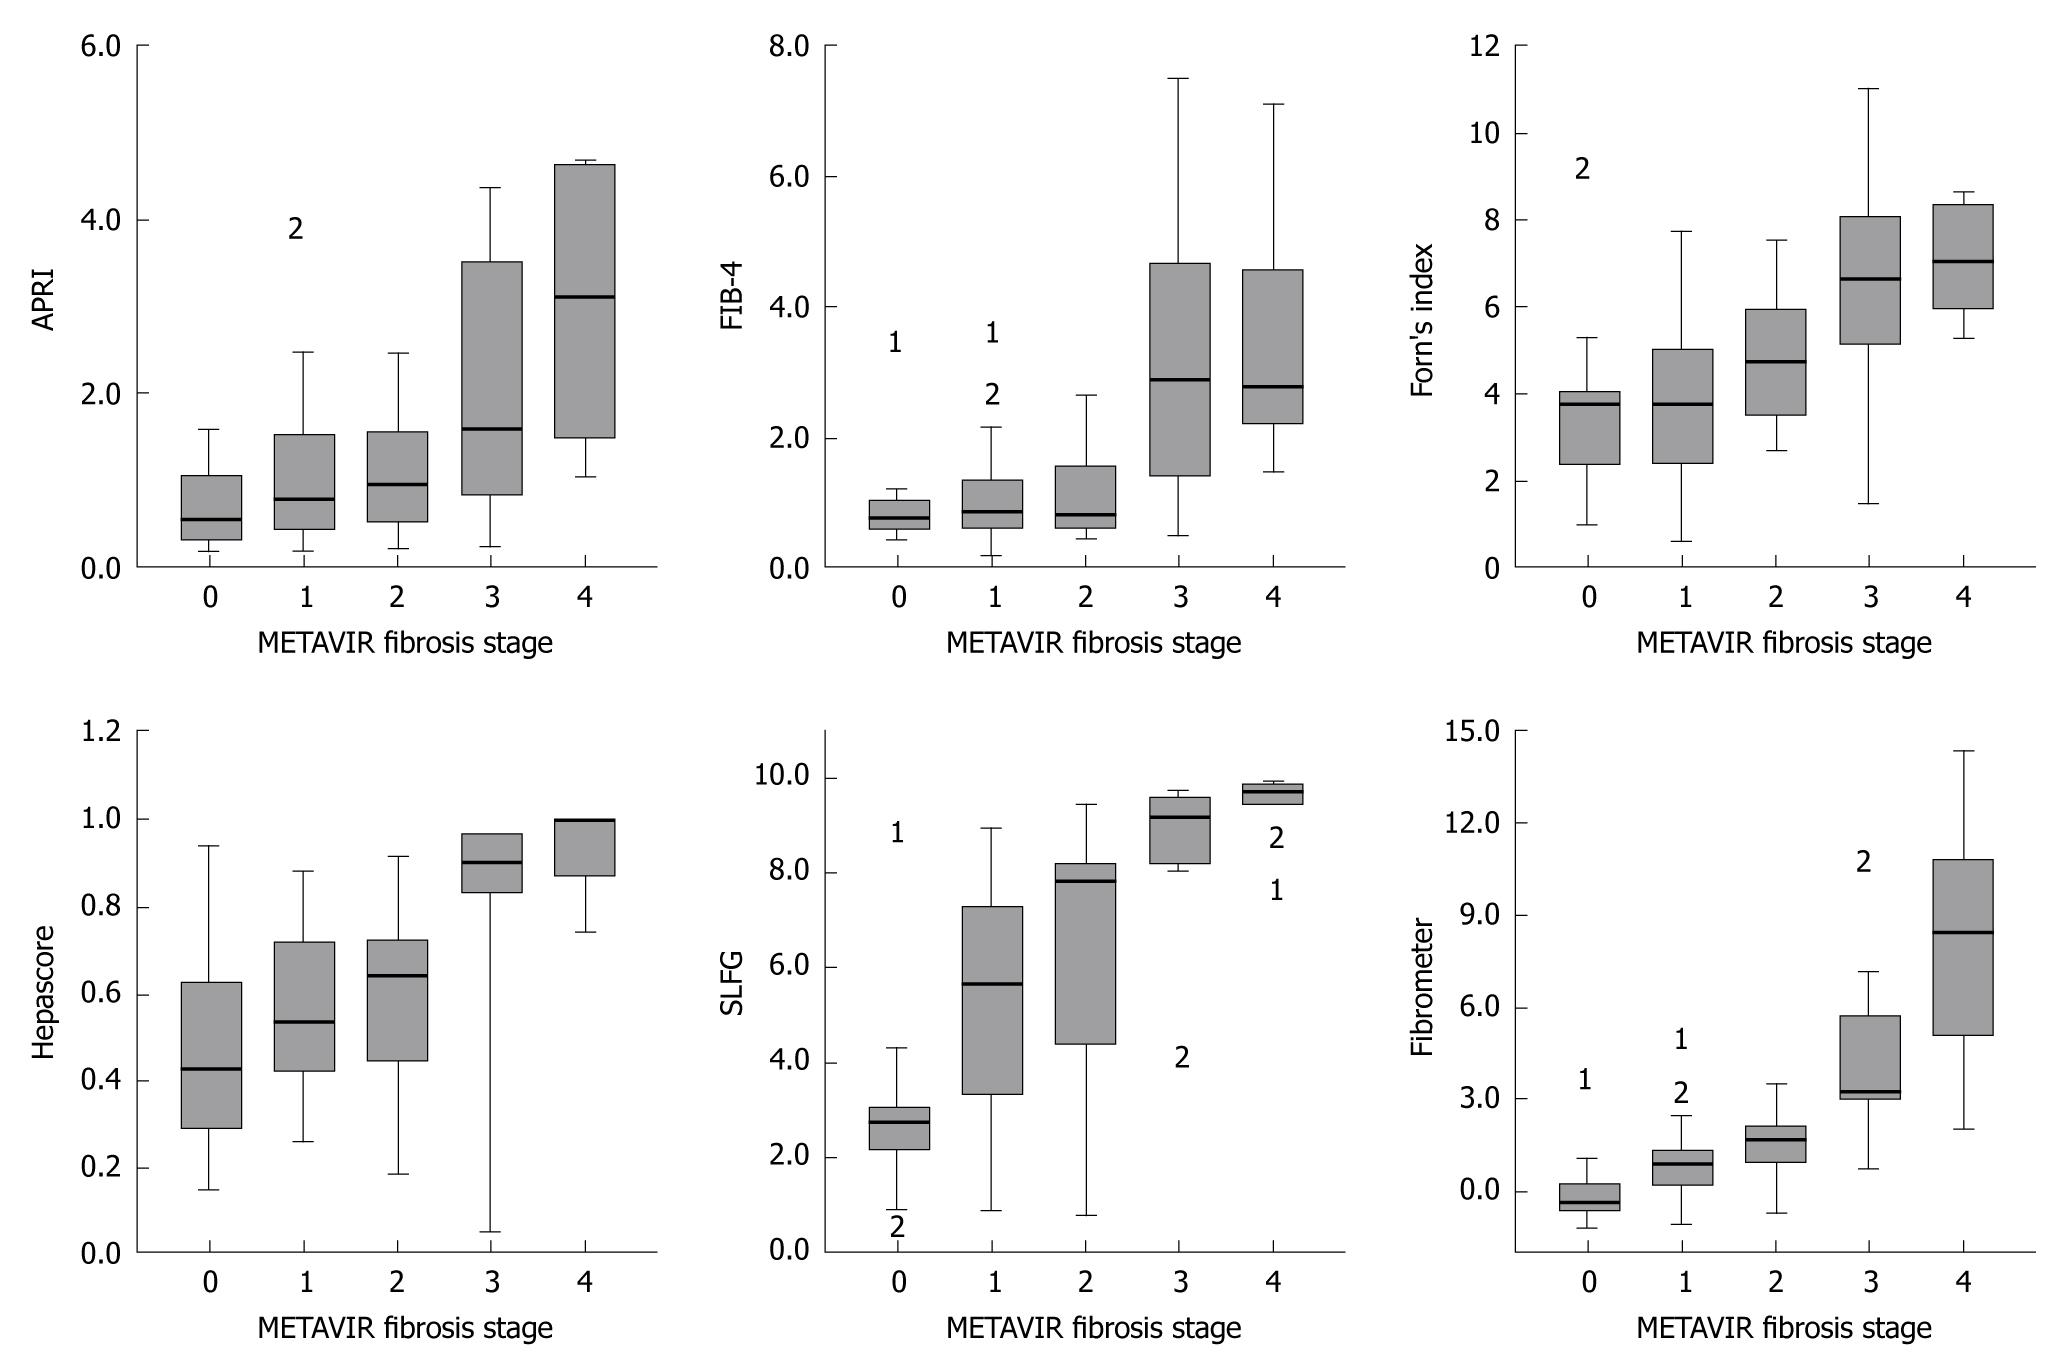
Figure 1 Model values according to METAVIR fibrosis stages.
The top and bottom of each box are the 25th and 75th centile interval, the line through the box is the median and the error bars are the 5th and 95th centile interval. 1 and 2 indicate the extreme values.
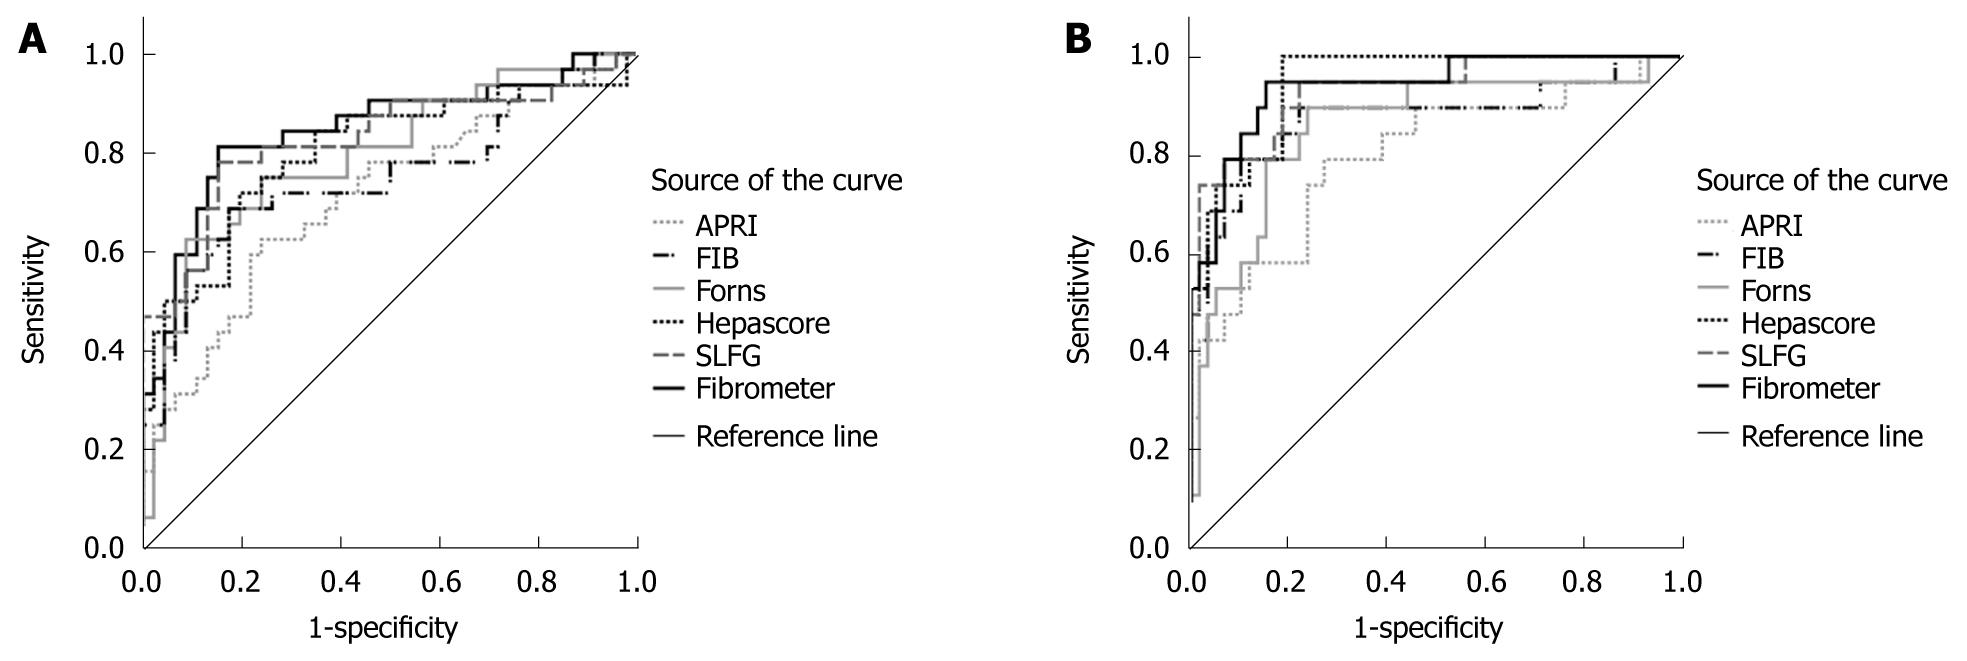
Figure 2 ROC curves for the 6 fibrosis models to discriminate METAVIR fibrosis stages F0-1 from F2-4 (A) and F0-2 from F3-4 (B).
- Citation: Wu SD, Wang JY, Li L. Staging of liver fibrosis in chronic hepatitis B patients with a composite predictive model: A comparative study. World J Gastroenterol 2010; 16(4): 501-507
- URL: https://www.wjgnet.com/1007-9327/full/v16/i4/501.htm
- DOI: https://dx.doi.org/10.3748/wjg.v16.i4.501


