Copyright
©2010 Baishideng.
World J Gastroenterol. Jan 28, 2010; 16(4): 445-452
Published online Jan 28, 2010. doi: 10.3748/wjg.v16.i4.445
Published online Jan 28, 2010. doi: 10.3748/wjg.v16.i4.445
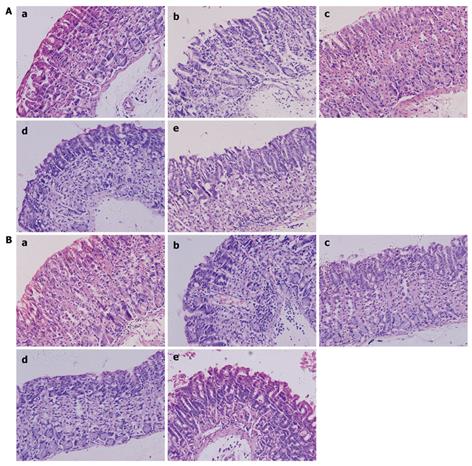
Figure 1 Histological image of gastric antrum and gastric body.
A: Histological image of gastric antrum. a: Normal group, normal mucosa, no mucosal erosion; b: NS group, extensive inflammation in the mucosal layer, massive mixed cell infiltration (mainly mononuclear); c: Triple group, slightinflammatory cell infiltration; d: L. fermenti group, a few incomplete mucosa; e: L. acidophilus group, slight inflammation with moderate cell infiltration, (HE, light microscope, × 200); B: Histological image of gastric body. a: Normal group, normal mucosa, no mucosal erosion; b: NS group, extensive inflammation in mucosal layer, even in submucosal layer with massive mixed cell infiltration; c: Triple group, a few incomplete mucosa, slight inflammatory cell infiltration; d: L. fermenti group, almost normal mucosa, slight cell infiltration; e: L. acidophilus group, moderate inflammation with cell infiltration in submucosa (HE, light microscope, × 200).
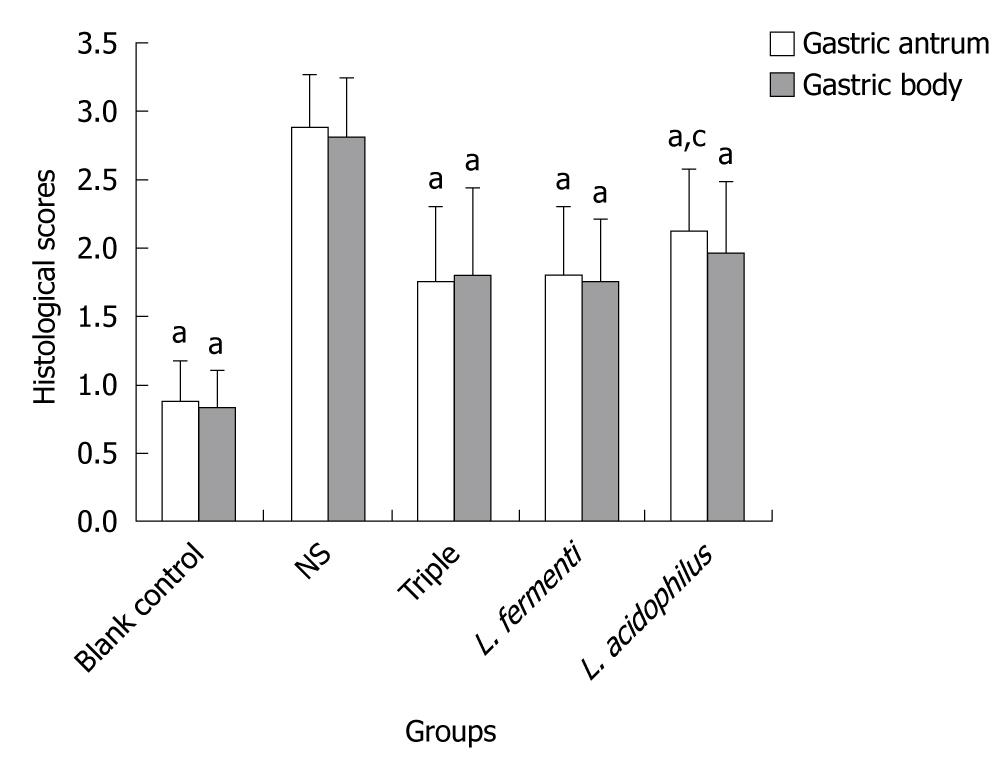
Figure 2 Histological score of all groups (mean ± SD, n = 10).
aP < 0.05 vs NS group. The highest score was 2.88 ± 0.38 in gastric antrum and 2.82 ± 0.42 in gastric body in NS group. cP < 0.05 vs blank control group.
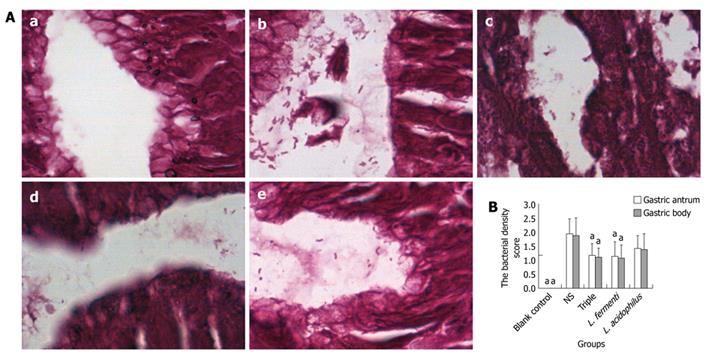
Figure 3 Bacterial density and bacterial density score of H.
pylori. A: Bacterial density of H. pylori. a: Normal group, no detectable H. pylori; b: NS group, over 10 H. pylori were detected in one field of view; c: Triple group; d: L. fermenti group; e: L. acidophilus group, (Giemsa, light microscope, × 1000). B: Bacterial density score of H. pylori. mean ± SD, n = 10. aP < 0.05 vs NS group. The highest score was 1.95 ± 0.52 in gastric antrum and 1.88 ± 0.63 in gastric body in NS group.
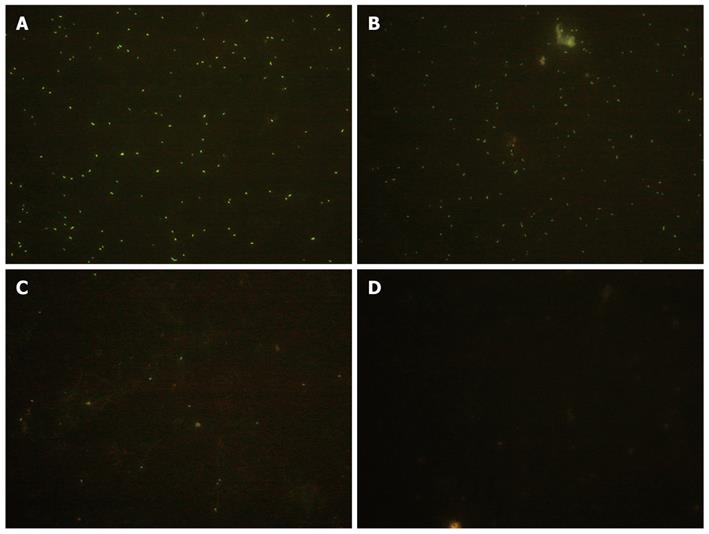
Figure 4 Fluorescent microscopic detection of L.
fermenti labeled with cFDA-SE. A: 2 h, a diffusely distributed cFDA-SE labeled bacteria under fluorescent microscopy; B: 4 h, slightly reduced in comparison with 2 h; C: 8 h, cFDA-SE labeled bacteria reduced obviously; D: Blank control group, no cFDA-SE labeled bacteria was detected.
-
Citation: Cui Y, Wang CL, Liu XW, Wang XH, Chen LL, Zhao X, Fu N, Lu FG. Two stomach-originated
lactobacillus strains improveHelicobacter pylori infected murine gastritis. World J Gastroenterol 2010; 16(4): 445-452 - URL: https://www.wjgnet.com/1007-9327/full/v16/i4/445.htm
- DOI: https://dx.doi.org/10.3748/wjg.v16.i4.445


